An Stock chart is extensively used to illustrate fluctuations in the data. It can represent fluctuations for stock, daily rainfall, or annual temperatures. Typically, this chart is ideal for analysing financial data and visualizing stock information.
The data arranged in columns or rows of a worksheet can be plotted in a Stock chart.
SpreadJS supports the following types of Stock charts. In the examples shown below, the market data anlysis at different time intervals is depicted with the help of different types of stock charts.
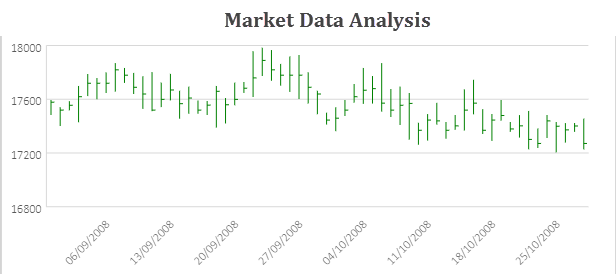
- High-Low-Close
A high-low-close chart displays the data values organized in the order : 1) high, 2) low, 3) close with the close value lying in between the high and low values.
An image of a high-low-close chart is shown below:

-
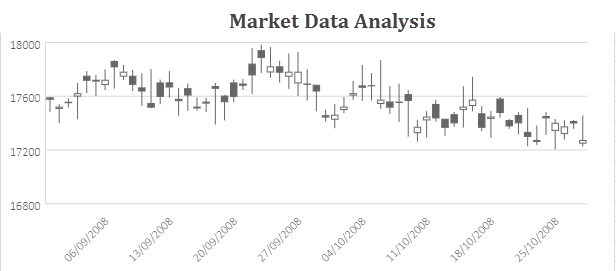
Open-High-Low-Close
An open-high-low-close chart displays the data values organized in the order : 1) open, 2) high, 3) low and then 4) close.
An image of a open-high-low-close chart is shown below:

-
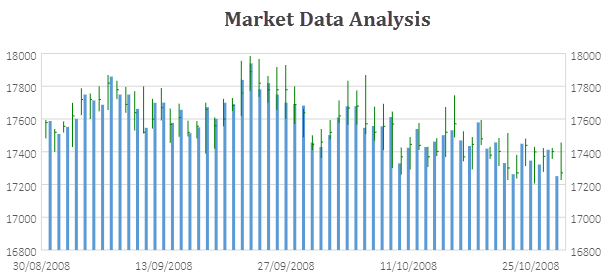
Volume-High-Low-Close
A volume-high-low-close chart displays the data values organized in the order : 1) volume, 2) high, 3) low and then 4) close.
An image of a volume-high-low-close chart is shown below:

-
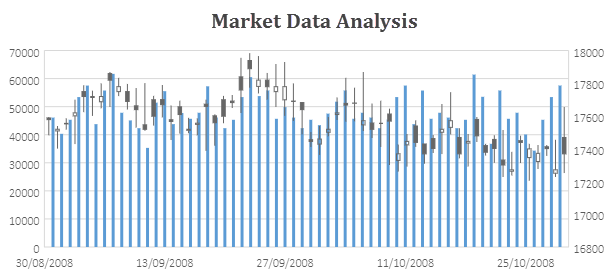
Volume-Open-High-Low-Close
A volume-open-high-low-close chart displays the data values organized in the order : 1) volume, 2) open, 3) high, 4) low and then 5) close.
An image of a volume-open-high-low-close chart is shown below:

Using Code
This code shows how to add different types of stock charts in a spreadsheet.
| JavaScript |
Copy Code
|
|---|---|
|
Click here to see code. var data = dataSource; function initSpread(spread) { spread.suspendPaint(); spread.options.tabStripRatio = 0.7;
var chartTypeStr = ['stockHLC', 'stockOHLC', 'stockVHLC', 'stockVOHLC']; var chartType = [{ type: GC.Spread.Sheets.Charts.ChartType.stockHLC, desc: chartTypeStr[0], }, { type: GC.Spread.Sheets.Charts.ChartType.stockOHLC, desc: chartTypeStr[1], }, { type: GC.Spread.Sheets.Charts.ChartType.stockVHLC, desc: chartTypeStr[2], }, { type: GC.Spread.Sheets.Charts.ChartType.stockVOHLC, desc: chartTypeStr[3], }];
var sheets = SpreadJS; var sheet = sheets[sheets.length - 1];
sheet.suspendPaint(); sheet.name(chartTypeStr[chartTypeStr.length - 1]); sheet.setArray(0, 0, data);
sheet.getRange(0, 0, 61, 1).formatter('dd/mm/yyyy');
sheet.setColumnWidth(0, 80); sheet.resumePaint(); initStockHLCChartSheetData(sheets[0], chartTypeStr[0]); initStockOHLCChartSheetData(sheets[1], chartTypeStr[1]); initStockVHLCChartSheetData(sheets[2], chartTypeStr[2]);
for (var i = 0; i < chartType.length; i++) {
sheet = sheets[i];
initChart(sheet, chartType[i].type, i);//add chart
} spread.resumePaint(); }
function initStockHLCChartSheetData(sheet, sheetName) {
sheet.name(sheetName); sheet.suspendPaint();
var formula = "='stockVOHLC'!"; for (var i = 0; i < data.length - 1; i++) { var formula1 = formula + 'A' + (i + 1);
sheet.setFormula(i, 0, formula1);
formula1 = formula + 'D' + (i + 1);
sheet.setFormula(i, 1, formula1);
formula1 = formula + 'E' + (i + 1);
sheet.setFormula(i, 2, formula1);
formula1 = formula + 'F' + (i + 1);
sheet.setFormula(i, 3, formula1); }
sheet.getRange(0, 0, 61, 1).formatter('dd/mm/yyyy');
sheet.setColumnWidth(0, 80); sheet.resumePaint(); }
function initStockOHLCChartSheetData(sheet, sheetName) {
sheet.name(sheetName); sheet.suspendPaint();
var formula = "='stockVOHLC'!"; for (var i = 0; i < data.length - 1; i++) { var formula1 = formula + 'A' + (i + 1);
sheet.setFormula(i, 0, formula1);
formula1 = formula + 'C' + (i + 1);
sheet.setFormula(i, 1, formula1);
formula1 = formula + 'D' + (i + 1);
sheet.setFormula(i, 2, formula1);
formula1 = formula + 'E' + (i + 1);
sheet.setFormula(i, 3, formula1);
formula1 = formula + 'F' + (i + 1);
sheet.setFormula(i, 4, formula1); }
sheet.getRange(0, 0, 61, 1).formatter('dd/mm/yyyy');
sheet.setColumnWidth(0, 80); sheet.resumePaint(); }
function initStockVHLCChartSheetData(sheet, sheetName) {
sheet.name(sheetName); sheet.suspendPaint();
var formula = "='stockVOHLC'!"; for (var i = 0; i < data.length - 1; i++) { var formula1 = formula + 'A' + (i + 1);
sheet.setFormula(i, 0, formula1);
formula1 = formula + 'B' + (i + 1);
sheet.setFormula(i, 1, formula1);
formula1 = formula + 'D' + (i + 1);
sheet.setFormula(i, 2, formula1);
formula1 = formula + 'E' + (i + 1);
sheet.setFormula(i, 3, formula1);
formula1 = formula + 'f' + (i + 1);
sheet.setFormula(i, 4, formula1); }
sheet.getRange(0, 0, 61, 1).formatter('dd/mm/yyyy');
sheet.setColumnWidth(0, 80); sheet.resumePaint(); }
function initChart(sheet, chartType, index) {
sheet.suspendPaint();
var rangeIndex = ['A1:D61', 'A1:E61', 'A1:E61', 'A1:F61']; //add chart var chart = sheet.charts.add('Chart1', chartType, 270, 60, 615, 270, rangeIndex[index]);
sheet.resumePaint(); }
|
|