SpreadJS Documentation
Creating Pie Chart
SpreadJS Documentation > Developer's Guide > Managing Data Visualization and Objects > Understanding Chart > Working with Chart Types > Creating Pie Chart

A pie chart is extensively used to display the size of each item in a single data series in proportion to a total quantity. Data points are shown as a percentage of the whole pie. This chart is ideal when you want to visualize data in terms of percentage or share.

The data arranged in columns or rows of a worksheet can be plotted in a pie chart. Typically, a pie chart is similar to a circle divided in small sectors representing fractions of the contribution of each category to the whole. These charts generally display only one group of data.

SpreadJS supports the following types of pie chart. In the examples shown below, the browser market share (in percentage) for different browsers is depicted in different types of pie charts.
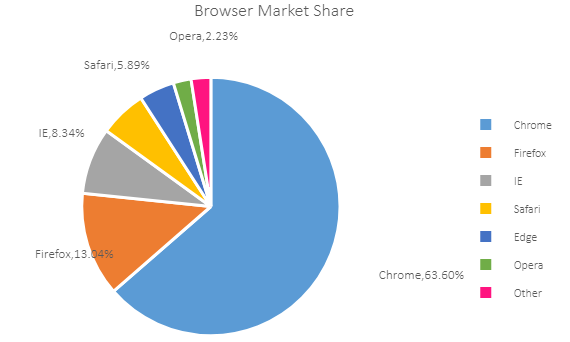
  1. Pie Chart

    This chart displays a single data series in a circle-type structure, with each sector representing a different category.

    An image of the pie chart is shown below:
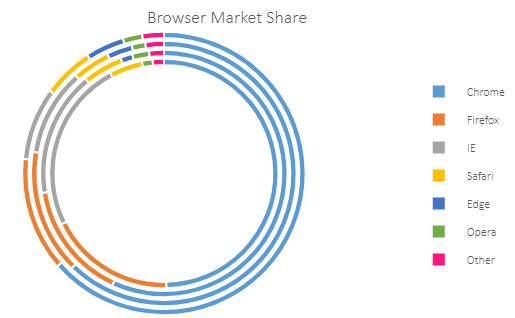
            

  2. Doughnut Chart

    This chart can display multiple data series concurrently, with each ring depicting a single data series.

    An image of the doughnut chart is shown below:


Using Code

This code shows how to add a pie chart and doughnut chart in the spreadsheet along with customization of some of the chart elements.

JavaScript
Copy Code

 function initSpread(spread) {
            spread.suspendPaint();
            var sheets = SpreadJS;
            initPieSheet(sheets[0]);
            initPieChart(sheets[0]);
            initDoughnutSheet(sheets[1]);
            initDoughnutChart(sheets[1]);
            spread.resumePaint();
        }

        function initPieSheet(sheet) {
            sheet.name('Pie');
            //prepare data for chart
            var dataArray = [
                ["", 'Chrome', 'Firefox', 'IE', 'Safari', 'Edge', 'Opera', 'Other'],
                ["2017", 0.6360, 0.1304, 0.0834, 0.0589, 0.0443, 0.0223, 0.0246]
            ];
            sheet.setArray(0, 0, dataArray);

        }
        function initPieChart(sheet) {
            var chart = sheet.charts.add('PieChart1', GC.Spread.Sheets.Charts.ChartType.pie, 0, 50, 600, 400, "A1:H2");
            showPieDataLabels(chart);
            changePieStyle(chart);
            changeChartTitle(chart);
        }

        function changeChartTitle(chart) {
            var title = chart.title();
            title.text = "Browser Market Share";
            title.fontSize = 18;
            chart.title(title);
        }

        // show dataLabels
        function showPieDataLabels(chart) {
            var dataLabels = chart.dataLabels();
            dataLabels.showValue = true;
            dataLabels.showSeriesName = false;
            dataLabels.showCategoryName = true;
            dataLabels.format = "0.00%";
            var dataLabelPosition = GC.Spread.Sheets.Charts.DataLabelPosition;
            dataLabels.position = dataLabelPosition.bestFit;
            chart.dataLabels(dataLabels);
        }

        //change pie color
        function changePieStyle(chart) {
            chart.legend({ position: GC.Spread.Sheets.Charts.LegendPosition.right });
            var seriesItem = chart.series().get(0);
            seriesItem.backColor = 'rgb(91, 155, 213),rgb(237, 125, 49),rgb(165, 165, 165),rgb(255, 192, 0),rgb(68, 114, 196),rgb(112, 173, 71),rgb(255,20,128)';
            seriesItem.border.width = 3;
            chart.series().set(0, seriesItem);
        }


        function initDoughnutSheet(sheet) {
            sheet.name('Doughnut');
            sheet.suspendPaint();
            //prepare data for chart
            var dataArray = [
                ["", 'Chrome', 'Firefox', 'IE', 'Safari', 'Edge', 'Opera', 'Other'],
                ["2014", 0.4966, 0.1801, 0.2455, 0.0470, 0.0, 0.0150, 0.0158],
                ["2015", 0.5689, 0.1560, 0.1652, 0.0529, 0.0158, 0.0220, 0.0192],
                ["2016", 0.6230, 0.1531, 0.1073, 0.0464, 0.0311, 0.0166, 0.0225],
                ["2017", 0.6360, 0.1304, 0.0834, 0.0589, 0.0443, 0.0223, 0.0246]
            ];
            sheet.setArray(0, 0, dataArray);
            sheet.resumePaint();
        }
        function initDoughnutChart(sheet) {
            var chart = sheet.charts.add('DoughnutChart1', GC.Spread.Sheets.Charts.ChartType.doughnut, 0, 100, 600, 320, "A1:H5");
            changeDoughnutColor(chart);
            changeDoughnutLegendPosition(chart);
            changeChartTitle(chart);
        }


        //change doughnut color
        function changeDoughnutColor(chart) {
            var series = chart.series().get();
            for (var i = 0; i < series.length; i++) {
                var seriesItem = series[i];
                seriesItem.backColor = 'rgb(91, 155, 213),rgb(237, 125, 49),rgb(165, 165, 165),rgb(255, 192, 0),rgb(68, 114, 196),rgb(112, 173, 71),rgb(255,20,128)';
                chart.series().set(i, seriesItem);
            }
        }

        function changeDoughnutLegendPosition(chart) {
            chart.legend({ position: GC.Spread.Sheets.Charts.LegendPosition.right });
        }