SpreadJS provides support for adding custom shapes in worksheets based on specific requirements. You can customize the shape model to draw a shape of your choice just like the way graphics are drawn onto a canvas.
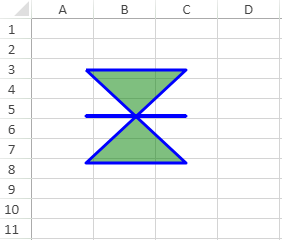
Shared below is a screenshot that depicts a custom shape added to the worksheet.
Using Code
This example shows how to add custom shape in the worksheet.
| JavaScript |
Copy Code
|
|---|---|
|
// Adding a custom shape to the worksheet window.onload = function () { // Define a model to create custom shape { { { { //Add defined custom shape to sheet |
|
Note: SpreadJS doesn't support the following scenarios while integrating custom shapes:
- Importing and exporting custom shapes to an excel file is not supported as of now.
- Shape text will only support : Horizontal direction, Horizontal and vertical text alignment, solid color fill, font (name and size) and margins etc.
- Flipped shapes (horizontal/vertical or both) are not fully supported as of now.
- The HitTest feature in shape of type : callout with out of shape bounds part is not fully supported. Hence, users can't select shape by clicking the out of shape bound part.