You can create a scatter sparkline using the ScatterSparkline formula and cell values.
The scatter sparkline formula has the following options:
| Option | Description |
| Points1 | The first xy data series. If the row count is greater than or equal to the column count, use data from the first two columns. The first column contains x-values and the second column contains y-values. If the row count is less than the column count, use data from the first two rows. The first row contains x-values and the second row contains y-values. |
| Points2 | The second xy data series. If the row count is greater than or equal to the column count, use data from the first two columns. The first column contains x-values and the second column contains y-values. If the row count is less than the column count, use data from the first two rows. The first row contains x-values and the second row contains y-values. |
| MinX | The x-minimum limit of both series, each series has its own value if it is omitted. |
| MaxX | The x-maximum limit of both series, each series has its own value if it is omitted. |
| MinY | The y-minimum limit of both series, each series has its own value if it is omitted. |
| MaxY | The y-maximum limit of both series, each series has its own value if it is omitted. |
| HLine | The horizontal axis position, there is no line if it is omitted. |
| VLine | The vertical axis position, there is no line if it is omitted. |
| XMinZone | The x-minimum value of the gray zone, there is no grey zone if any of these four parameters are omitted. |
| XMaxZone | The x-maximum value of the gray zone, there is no grey zone if any of these four parameters are omitted. |
| YMinZone | The y-minimum value of the gray zone, there is no grey zone if any of these four parameters are omitted. |
| YMaxZone | The y-maximum value of the gray zone, there is no grey zone if any of these four parameters are omitted. |
| Tags | If this option is true, mark the point at which the y-value is the maximum of the first series as "#0000FF", and mark the point at which the y-value is the minimum of the first series as "#CB0000". This option is false if it is omitted. |
| DrawSymbol | If this option is true, draw each point as a symbol. The symbol of the first series is a circle, and the symbol of the second series is a square. This option is true if it is omitted. |
| DrawLines | If this option is true, connect each point with a line by sequence in each series. This option is false if it is omitted. |
| Color1 | The color string of the first point series. The value is "#969696" if it is omitted. |
| Color2 | The color string of the second point series. The value is "#CB0000" if it is omitted. |
| Dash | If this option is true, the line is a dashed line; otherwise, the line is a full line. This option is false if it is omitted. |
The scatter sparkline formula has the following format:
=SCATTERSPARKLINE(points1, points2, minX, maxX, minY, maxY, hLine, vLine, xMinZone, xMaxZone, yMinZone, yMaxZone, tags, drawSymbol, drawLines, color1, color2, dash)
Using Code
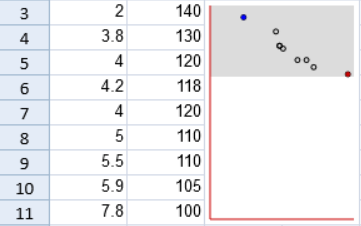
This example creates a scatter sparkline.
| JavaScript |
Copy Code
|
|---|---|
| activeSheet.setValue(2, 0, 2.0); activeSheet.setValue(2, 1, 140); activeSheet.setValue(3, 0, 3.8); activeSheet.setValue(3, 1, 130); activeSheet.setValue(4, 0, 4.0); activeSheet.setValue(4, 1, 120); activeSheet.setValue(5, 0, 4.2); activeSheet.setValue(5, 1, 118); activeSheet.setValue(6, 0, 4.0); activeSheet.setValue(6, 1, 120); activeSheet.setValue(7, 0, 5.0); activeSheet.setValue(7, 1, 110); activeSheet.setValue(8, 0, 5.5); activeSheet.setValue(8, 1, 110); activeSheet.setValue(9, 0, 5.9); activeSheet.setValue(9, 1, 105); activeSheet.setValue(10, 0, 7.8); activeSheet.setValue(10, 1, 100); activeSheet.addSpan(2, 2, 9, 2); activeSheet.setFormula(2, 2, '=SCATTERSPARKLINE(A3:B11,,0,8,0,150,0,0,0,8,100,150,TRUE,TRUE,FALSE,"FD8E2C")'); activeSheet.setRowHeight(0, 50); |
|
See Also