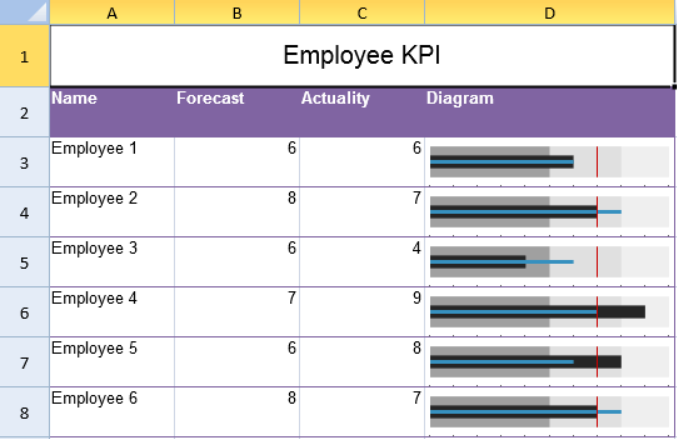
You can create a bullet sparkline using the BulletSparkline formula and cell values.
The bullet sparkline formula has the following options:
| Option | Description |
| Measure | A number or reference that represents the length of the measure bar, such as 5 or "A1". |
| Target | A number or reference that represents the location of the target line, such as 7 or "A2". |
| Maxi | A number or reference that represents the maximum value of the sparkline, such as 10 or "A3". |
| Good | A number or reference that represents the length of the good bar, such as 3 or "A4". This setting is optional. The default value is 0. |
| Bad | A number or reference that represents the length of the bad bar, such as 1 or "A5". This setting is optional. The default value is 0. |
| Forecast | A number or reference that represents the length of the forecast line, such as 8 or "A6". This setting is optional. The default value is 0. |
| Tickunit | A number or reference that represents the tick unit, such as 1 or "A7". This setting is optional. The default value is 0. |
| ColorScheme | A string that represents a color scheme for displaying the sparkline. This setting is optional. The default value is "#A0A0A0". |
| Vertical | A boolean that represents whether to display the sparkline vertically. This setting is optional. The default value is false. |
The bullet sparkline formula has the following format:
=BULLETSPARKLINE(measure, target, maxi, good?, bad?, forecast?, tickunit?, colorScheme?, vertical?)
Using Code
The following code creates bullet sparklines.
| JavaScript |
Copy Code
|
|---|---|
| activeSheet.addSpan(0, 0, 1, 4); activeSheet.getCell(0, 0, GC.Spread.Sheets.SheetArea.viewport).value("Employee KPI").font("20px Arial").hAlign(GC.Spread.Sheets.HorizontalAlign.center).vAlign(GC.Spread.Sheets.VerticalAlign.center); var table1 = activeSheet.tables.add("table1", 1, 0, 7, 4, GC.Spread.Sheets.Tables.TableThemes.light12); table1.filterButtonVisible(false); activeSheet.setValue(1, 0, "Name"); activeSheet.setValue(1, 1, "Forecast"); activeSheet.setValue(1, 2, "Actuality"); activeSheet.setValue(1, 3, "Diagram"); activeSheet.setValue(2, 0, "Employee 1"); activeSheet.setValue(2, 1, 6); activeSheet.setValue(2, 2, 6); activeSheet.setValue(3, 0, "Employee 2"); activeSheet.setValue(3, 1, 8); activeSheet.setValue(3, 2, 7); activeSheet.setValue(4, 0, "Employee 3"); activeSheet.setValue(4, 1, 6); activeSheet.setValue(4, 2, 4); activeSheet.setValue(5, 0, "Employee 4"); activeSheet.setValue(5, 1, 7); activeSheet.setValue(5, 2, 9); activeSheet.setValue(6, 0, "Employee 5"); activeSheet.setValue(6, 1, 6); activeSheet.setValue(6, 2, 8); activeSheet.setValue(7, 0, "Employee 6"); activeSheet.setValue(7, 1, 8); activeSheet.setValue(7, 2, 7); activeSheet.setFormula(2, 3, '=BULLETSPARKLINE(C3,7,10,8,5,B3,1'); activeSheet.setFormula(3, 3, '=BULLETSPARKLINE(C4,7,10,8,5,B4,1'); activeSheet.setFormula(4, 3, '=BULLETSPARKLINE(C5,7,10,8,5,B5,1'); activeSheet.setFormula(5, 3, '=BULLETSPARKLINE(C6,7,10,8,5,B6,1'); activeSheet.setFormula(6, 3, '=BULLETSPARKLINE(C7,7,10,8,5,B7,1'); activeSheet.setFormula(7, 3, '=BULLETSPARKLINE(C8,7,10,8,5,B8,1'); activeSheet.setRowHeight(0, 50); for (var i = 1; i < 8; i++) { activeSheet.setRowHeight(i, 40); } activeSheet.setColumnWidth(0, 100); activeSheet.setColumnWidth(1, 100); activeSheet.setColumnWidth(2, 100); activeSheet.setColumnWidth(3, 200); |
|
See Also