You can display a horizontal axis or vertical orientation with line, column, and winloss sparklines.
You can display the horizontal axis with the options.displayXAxis property when adding the sparkline with a method. You can specify horizontal or vertical orientation with the dataOrientation method when adding the sparkline with a method. You can specify a data range or a date axis range. The line, column, and winloss formulas have options for setting the axis or orientation.
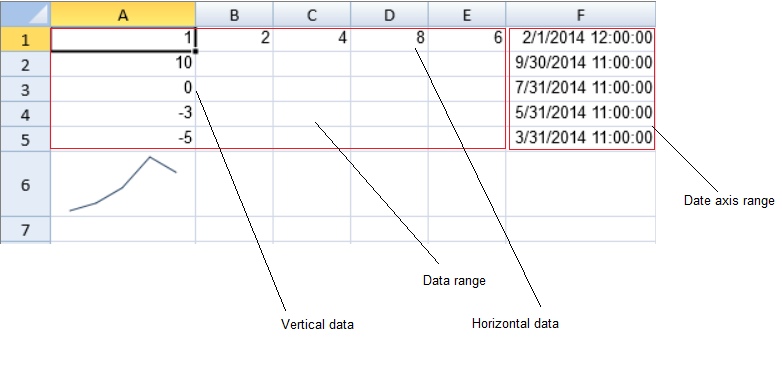
The following image displays a data range with horizontal and vertical data and a date axis range. The horizontal date range is similar to the horizontal data range.
Using Code
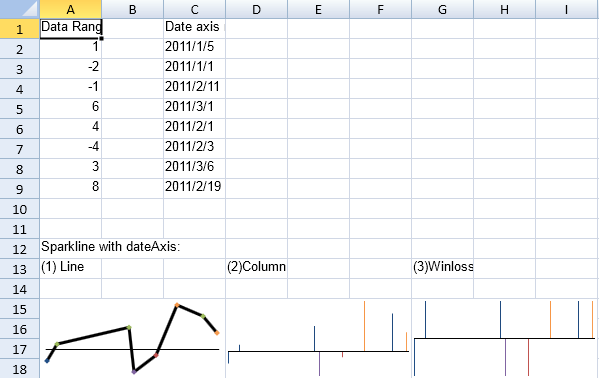
This example displays a date axis.
| JavaScript |
Copy Code
|
|---|---|
|
activeSheet.setValue(0, 0, "Data Range is A2-A9"); var data = new GC.Spread.Sheets.Range(1, 0, 8, 1); var setting = new GC.Spread.Sheets.Sparklines.SparklineSetting(); setting.options.seriesColor = "Text 2 1"; //line //winloss |
|
Using Code
The following example creates a sparkline that uses horizontal data (1,2,4,8,6) from the data range. The numbers below the image were added for illustration.

| JavaScript |
Copy Code
|
|---|---|
| activeSheet.setValue(1, 0, 10); activeSheet.setValue(2, 0, 0); activeSheet.setValue(3, 0, -3); activeSheet.setValue(4, 0, -5); activeSheet.setValue(0, 0, 1); activeSheet.setValue(0, 1, 2); activeSheet.setValue(0, 2, 4); activeSheet.setValue(0, 3, 8); activeSheet.setValue(0, 4, 6); activeSheet.setValue(0, 5, new Date(2014, 1, 1)); activeSheet.setValue(1, 5, new Date(2014, 9, 1)); activeSheet.setValue(2, 5, new Date(2014, 7, 1)); activeSheet.setValue(3, 5, new Date(2014, 5, 1)); activeSheet.setValue(4, 5, new Date(2014, 3, 1)); var sparkline = activeSheet.setSparkline(5, 0, new GC.Spread.Sheets.Range(0, 0, 5, 5), GC.Spread.Sheets.Sparklines.DataOrientation.Horizontal, GC.Spread.Sheets.Sparklines.SparklineType.line, new GC.Spread.Sheets.Sparklines.SparklineSetting(), new GC.Spread.Sheets.Range(0, 5, 5, 1), GC.Spread.Sheets.Sparklines.DataOrientation.Vertical); sparkline.displayDateAxis(false); |
|
Using Code
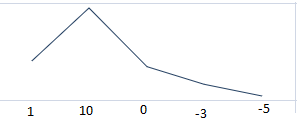
The following example creates a sparkline that uses vertical data (1,10,0,-3,-5) from the data range. The numbers below the image were added for illustration.
| JavaScript |
Copy Code
|
|---|---|
| activeSheet.setValue(1, 0, 10); activeSheet.setValue(2, 0, 0); activeSheet.setValue(3, 0, -3); activeSheet.setValue(4, 0, -5); activeSheet.setValue(0, 0, 1); activeSheet.setValue(0, 1, 2); activeSheet.setValue(0, 2, 4); activeSheet.setValue(0, 3, 8); activeSheet.setValue(0, 4, 6); activeSheet.setValue(0, 5, new Date(2014, 1, 1)); activeSheet.setValue(1, 5, new Date(2014, 9, 1)); activeSheet.setValue(2, 5, new Date(2014, 7, 1)); activeSheet.setValue(3, 5, new Date(2014, 5, 1)); activeSheet.setValue(4, 5, new Date(2014, 3, 1)); var sparkline = activeSheet.setSparkline(5, 0, new GC.Spread.Sheets.Range(0, 0, 5, 5), GC.Spread.Sheets.Sparklines.DataOrientation.Horizontal, GC.Spread.Sheets.Sparklines.SparklineType.line, new GC.Spread.Sheets.Sparklines.SparklineSetting(), new GC.Spread.Sheets.Range(0, 5, 5, 1), GC.Spread.Sheets.Sparklines.DataOrientation.Vertical); sparkline.displayDateAxis(false); sparkline.dataOrientation(GC.Spread.Sheets.Sparklines.DataOrientation.Vertical); |
|
Using Code
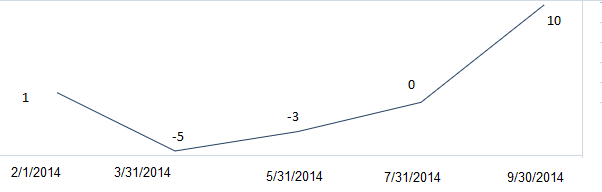
The following example creates a sparkline that uses vertical data (1,10,0,-3,-5) with the date range. The numbers in the image were added for illustration.
| JavaScript |
Copy Code
|
|---|---|
| activeSheet.setValue(1, 0, 10); activeSheet.setValue(2, 0, 0); activeSheet.setValue(3, 0, -3); activeSheet.setValue(4, 0, -5); activeSheet.setValue(0, 0, 1); activeSheet.setValue(0, 1, 2); activeSheet.setValue(0, 2, 4); activeSheet.setValue(0, 3, 8); activeSheet.setValue(0, 4, 6); activeSheet.setValue(0, 5, new Date(2014, 1, 1)); activeSheet.setValue(1, 5, new Date(2014, 9, 1)); activeSheet.setValue(2, 5, new Date(2014, 7, 1)); activeSheet.setValue(3, 5, new Date(2014, 5, 1)); activeSheet.setValue(4, 5, new Date(2014, 3, 1)); var sparkline = activeSheet.setSparkline(5, 0, new GC.Spread.Sheets.Range(0, 0, 5, 5), GC.Spread.Sheets.Sparklines.DataOrientation.Horizontal, GC.Spread.Sheets.Sparklines.SparklineType.line, new GC.Spread.Sheets.Sparklines.SparklineSetting(), new GC.Spread.Sheets.Range(0, 5, 5, 1), GC.Spread.Sheets.Sparklines.DataOrientation.Vertical); sparkline.dataOrientation(GC.Spread.Sheets.Sparklines.DataOrientation.Vertical); sparkline.displayDateAxis(true); |
|