In Spread.Services, the chart feature provides extensive support for creating various types of charts including both 2-D and 3-D views.
Chart objects are fully customizable. Shared below is a list of charting objects that can be modified in charts created using Spread.Services:
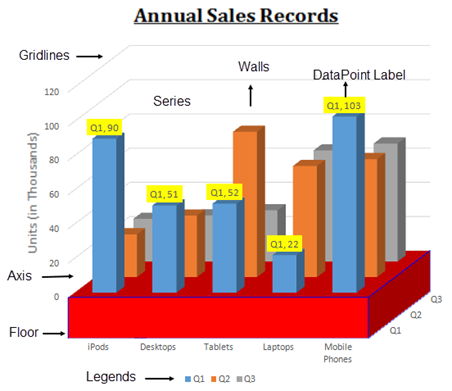
The following diagram displays a sample chart depicting the annual sales records of different electronic gadgets per quarter along with the chart objects that can be customized in a worksheet.
