The horizontal axis has a general type. The general type specifies that all the points are painted along the axis at the same distance.
Set the DisplayXAxis property if you wish to display the axis line. The following image displays all three points on the graph.
You can specify different minimum and maximum value options for the vertical axis. The automatic option allows each sparkline to have a different minimum and maximum value. The same option uses the same minimum and maximum value for all the sparklines. The custom option allows you to specify the minimum and maximum value for all the sparklines in a group.
If the custom option is used for the vertical axis, and the minimum value is equal to or larger than all data points, points or lines are not drawn. Lines or columns are truncated if they are not completely in the drawing area. If a column sparkline has at least one point drawn completely or partially, then all columns with values less than the minimum are drawn as thin columns that extend down.
See the ManualMax, ManualMin, MaxAxisType, and MinAxisType properties in the ExcelSparklineSetting class for vertical axis examples.
Using Code
- Create an ExcelSparklineSetting object.
- Set the DisplayXAxis property to true if you wish to display the axis.
- Add values and dates to the cells.
- Add the sparkline to the cell.
Example
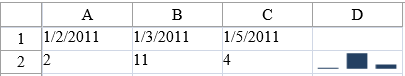
This example creates a column sparkline in a cell with a horizontal axis.
| C# |
Copy Code
|
|---|---|
FarPoint.Web.Spread.ExcelSparklineSetting ex = new FarPoint.Web.Spread.ExcelSparklineSetting(); ex.DisplayXAxis = true; ex.Formula = "Sheet1!$A$1:$C$1"; fpSpread1.Sheets[0].RowCount = 4; fpSpread1.Sheets[0].ColumnCount = 4; fpSpread1.Sheets[0].Cells[0, 0].Text = "1/2/2011"; fpSpread1.Sheets[0].Cells[0, 1].Text = "1/3/2011"; fpSpread1.Sheets[0].Cells[0, 2].Text = "1/5/2011"; fpSpread1.Sheets[0].Cells[1, 0].Value = 2; fpSpread1.Sheets[0].Cells[1, 1].Value = 11; fpSpread1.Sheets[0].Cells[1, 2].Value = 4; fpSpread1.Sheets[0].AddSparkline("Sheet1!$A$2:$C$2", "Sheet1!$D$2:$D$2", FarPoint.Web.Spread.SparklineType.Column, ex); |
|
| VB |
Copy Code
|
|---|---|
Dim ex As New FarPoint.Web.Spread.ExcelSparklineSetting() ex.DisplayXAxis = True ex.Formula = "Sheet1!$A$1:$C$1" FpSpread1.Sheets(0).RowCount = 4 FpSpread1.Sheets(0).ColumnCount = 4 FpSpread1.Sheets(0).Cells(0, 0).Text = "1/2/2011" FpSpread1.Sheets(0).Cells(0, 1).Text = "1/3/2011" FpSpread1.Sheets(0).Cells(0, 2).Text = "1/5/2011" FpSpread1.Sheets(0).Cells(1, 0).Value = 2 FpSpread1.Sheets(0).Cells(1, 1).Value = 11 FpSpread1.Sheets(0).Cells(1, 2).Value = 4 FpSpread1.Sheets(0).AddSparkline("Sheet1!$A$2:$C$2", "Sheet1!$D$2:$D$2", FarPoint.Web.Spread.SparklineType.Column, ex) |
|
Using the Spread Designer
- Type data in a cell or a column or row of cells in the designer.
- Type dates in a cell or a column or row of cells in the designer.
- Select a cell for the sparkline.
- Select the Insert menu.
- Select a sparkline type.
- Set the Data Range in the Create Sparklines dialog (such as =Sheet1!$E$1:$E$3).
- Select OK.
- Select the sparkline cell, select the Axis icon, and then make any changes to the axis.
- Select Apply and Exit from the File menu to save your changes and close the designer.