The elevation rotates the graph counterclockwise around the horizontal axis. The following image displays a graph with a changed elevation.
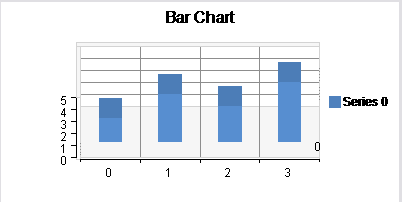
For API information, see the Elevation property.
The rotation rotates the graph counterclockwise around the vertical axis. The following image displays a graph with a changed rotation.
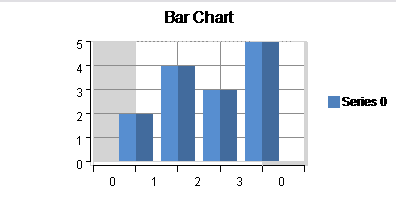
For API information, see the Rotation property.
Using Code
You can set the Elevation and Rotation properties.
Example
The following example sets Elevation and Rotation. Use this code with a 3D chart.
| C# |
Copy Code
|
|---|---|
YPlotArea plotArea = new YPlotArea(); plotArea.Location = new PointF(0.2f, 0.2f); plotArea.Size = new SizeF(0.6f, 0.6f); plotArea.Rotation = 20; plotArea.Elevation = 15; |
|
| VB |
Copy Code
|
|---|---|
Dim plotArea As New FarPoint.Web.Chart.YPlotArea() plotArea.Location = New System.Drawing.PointF(0.2F, 0.2F) plotArea.Size = New System.Drawing.SizeF(0.6F, 0.6F) plotArea.Rotation = 20 plotArea.Elevation = 15 |
|
See Also