You can display a horizontal axis or vertical orientation with line, column, and winloss sparklines.
You can display the horizontal axis with the displayXAxis property when adding the sparkline with a method. You can specify horizontal or vertical orientation with the dataOrientation method when adding the sparkline with a method. You can specify a data range or a date axis range. The line, column, and winloss formulas have options for setting the axis or orientation.
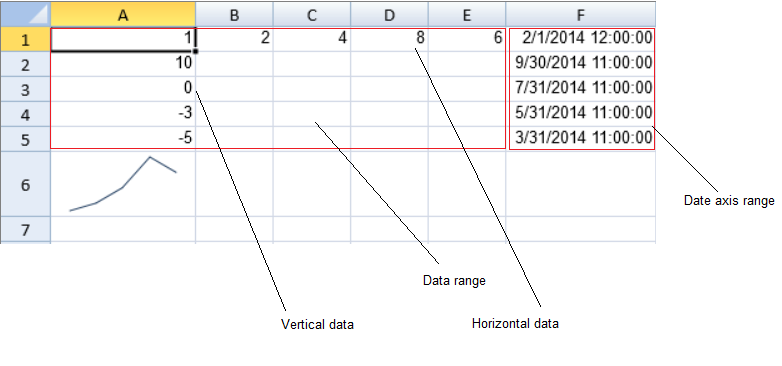
The following image displays a data range with horizontal and vertical data and a date axis range. The horizontal date range is similar to the horizontal data range.
Using Code
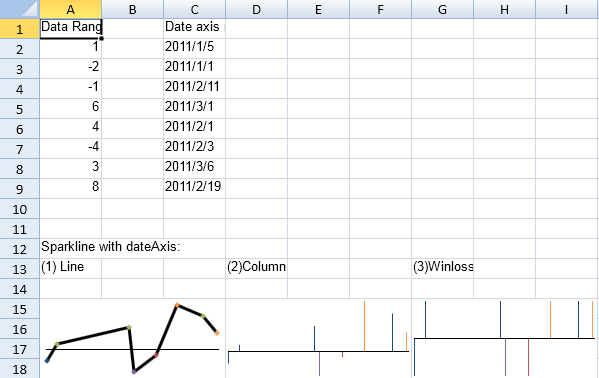
This example displays a date axis.
| JavaScript |
Copy Code
|
|---|---|
| activeSheet.setValue(0, 0, "Data Range is A2-A9"); activeSheet.setValue(1, 0, 1); activeSheet.setValue(2, 0, -2); activeSheet.setValue(3, 0, -1); activeSheet.setValue(4, 0, 6); activeSheet.setValue(5, 0, 4); activeSheet.setValue(6, 0, -4); activeSheet.setValue(7, 0, 3); activeSheet.setValue(8, 0, 8); activeSheet.setValue(0, 2, "Date axis range is C2-C9"); activeSheet.setValue(1, 2, '2011/1/5'); activeSheet.setValue(2, 2, '2011/1/1'); activeSheet.setValue(3, 2, '2011/2/11'); activeSheet.setValue(4, 2, '2011/3/1'); activeSheet.setValue(5, 2, '2011/2/1'); activeSheet.setValue(6, 2, '2011/2/3'); activeSheet.setValue(7, 2, '2011/3/6'); activeSheet.setValue(8, 2, '2011/2/19'); var data = new GcSpread.Sheets.Range(1, 0, 8, 1); var dateAxis = new GcSpread.Sheets.Range(1, 2, 8, 1); var setting = new GcSpread.Sheets.SparklineSetting(); setting.showMarkers(true); setting.lineWeight = 3; setting.displayXAxis = true; setting.showFirst(true); setting.showLast(true); setting.showLow(true); setting.showHigh(true); setting.showNegative(true); setting.seriesColor('Text 2 1'); setting.firstMarkerColor('Text 2 3'); setting.negativeColor('Accent 2 1'); setting.markersColor('Accent 3 1'); setting.lowMarkerColor('Accent 4 1'); setting.highMarkerColor('Accent 6 1'); setting.lastMarkerColor('Accent 6 6'); setting.axisColor('Text 1 1'); activeSheet.addSpan(11, 0, 1, 3, null) activeSheet.setText(11, 0, "Sparkline with dateAxis:", null); activeSheet.setText(12, 0, "(1) Line", null); activeSheet.setText(12, 3, "(2)Column", null); activeSheet.setText(12, 6, "(3)Winloss", null); //line activeSheet.addSpan(14, 0, 4, 3, null); activeSheet.setSparkline(14, 0, data , GcSpread.Sheets.DataOrientation.Vertical , GcSpread.Sheets.SparklineType.line , setting , dateAxis , GcSpread.Sheets.DataOrientation.Vertical ); //column activeSheet.addSpan(14, 3, 4, 3, null); activeSheet.setSparkline(14, 3, data , GcSpread.Sheets.DataOrientation.Vertical , GcSpread.Sheets.SparklineType.column , setting , dateAxis , GcSpread.Sheets.DataOrientation.Vertical ); //winloss activeSheet.addSpan(14, 6, 4, 3, null); activeSheet.setSparkline(14, 6, data , GcSpread.Sheets.DataOrientation.Vertical , GcSpread.Sheets.SparklineType.winloss , setting , dateAxis , GcSpread.Sheets.DataOrientation.Vertical ); |
|
Using Code
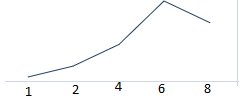
The following example creates a sparkline that uses horizontal data (1,2,4,8,6) from the data range. The numbers below the image were added for illustration.
| JavaScript |
Copy Code
|
|---|---|
| activeSheet.isPaintSuspended(true); activeSheet.setValue(1, 0, 10); activeSheet.setValue(2, 0, 0); activeSheet.setValue(3, 0, -3); activeSheet.setValue(4, 0, -5); activeSheet.setValue(0, 0, 1); activeSheet.setValue(0, 1, 2); activeSheet.setValue(0, 2, 4); activeSheet.setValue(0, 3, 8); activeSheet.setValue(0, 4, 6); activeSheet.setValue(0, 5, new Date(2014, 1, 1)); activeSheet.setValue(1, 5, new Date(2014, 9, 1)); activeSheet.setValue(2, 5, new Date(2014, 7, 1)); activeSheet.setValue(3, 5, new Date(2014, 5, 1)); activeSheet.setValue(4, 5, new Date(2014, 3, 1)); var sparkline = activeSheet.setSparkline(5, 0, new GcSpread.Sheets.Range(0, 0, 5, 5), GcSpread.Sheets.DataOrientation.Horizontal, GcSpread.Sheets.SparklineType.line, new GcSpread.Sheets.SparklineSetting(), new GcSpread.Sheets.Range(0, 5, 5, 1), GcSpread.Sheets.DataOrientation.Vertical); sparkline.displayDateAxis(false); activeSheet.isPaintSuspended(false); |
|
Using Code
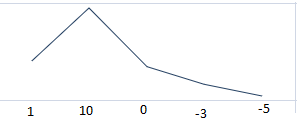
The following example creates a sparkline that uses vertical data (1,10,0,-3,-5) from the data range. The numbers below the image were added for illustration.
| JavaScript |
Copy Code
|
|---|---|
| activeSheet.isPaintSuspended(true); activeSheet.setValue(1, 0, 10); activeSheet.setValue(2, 0, 0); activeSheet.setValue(3, 0, -3); activeSheet.setValue(4, 0, -5); activeSheet.setValue(0, 0, 1); activeSheet.setValue(0, 1, 2); activeSheet.setValue(0, 2, 4); activeSheet.setValue(0, 3, 8); activeSheet.setValue(0, 4, 6); activeSheet.setValue(0, 5, new Date(2014, 1, 1)); activeSheet.setValue(1, 5, new Date(2014, 9, 1)); activeSheet.setValue(2, 5, new Date(2014, 7, 1)); activeSheet.setValue(3, 5, new Date(2014, 5, 1)); activeSheet.setValue(4, 5, new Date(2014, 3, 1)); var sparkline = activeSheet.setSparkline(5, 0, new GcSpread.Sheets.Range(0, 0, 5, 5), GcSpread.Sheets.DataOrientation.Horizontal, GcSpread.Sheets.SparklineType.line, new GcSpread.Sheets.SparklineSetting(), new GcSpread.Sheets.Range(0, 5, 5, 1), GcSpread.Sheets.DataOrientation.Vertical); sparkline.displayDateAxis(false); sparkline.dataOrientation(GcSpread.Sheets.DataOrientation.Vertical); activeSheet.isPaintSuspended(false); |
|
Using Code
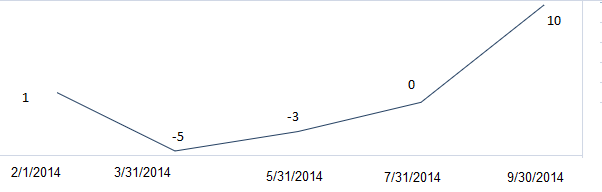
The following example creates a sparkline that uses vertical data (1,10,0,-3,-5) with the date range. The numbers in the image were added for illustration.
| JavaScript |
Copy Code
|
|---|---|
| activeSheet.isPaintSuspended(true); activeSheet.setValue(1, 0, 10); activeSheet.setValue(2, 0, 0); activeSheet.setValue(3, 0, -3); activeSheet.setValue(4, 0, -5); activeSheet.setValue(0, 0, 1); activeSheet.setValue(0, 1, 2); activeSheet.setValue(0, 2, 4); activeSheet.setValue(0, 3, 8); activeSheet.setValue(0, 4, 6); activeSheet.setValue(0, 5, new Date(2014, 1, 1)); activeSheet.setValue(1, 5, new Date(2014, 9, 1)); activeSheet.setValue(2, 5, new Date(2014, 7, 1)); activeSheet.setValue(3, 5, new Date(2014, 5, 1)); activeSheet.setValue(4, 5, new Date(2014, 3, 1)); var sparkline = activeSheet.setSparkline(5, 0, new GcSpread.Sheets.Range(0, 0, 5, 5), GcSpread.Sheets.DataOrientation.Horizontal, GcSpread.Sheets.SparklineType.line, new GcSpread.Sheets.SparklineSetting(), new GcSpread.Sheets.Range(0, 5, 5, 1), GcSpread.Sheets.DataOrientation.Vertical); sparkline.dataOrientation(GcSpread.Sheets.DataOrientation.Vertical); sparkline.displayDateAxis(true); activeSheet.isPaintSuspended(false); |
|