The server-side charting components (one each for 2D and 3D) share a common API with the client-side ComponentOne Chart controls. The API has been slightly modified to suit the server-side needs. Specifically, the ability to explicitly set the chart's Width and Height properties has been added.
All other top-level properties and methods of the ComponentOne Chart objects are exposed by the matching server-side component. This means that developers experienced with ComponentOne Chart will be able to exploit their existing knowledge and code when working with ComponentOne WebChart -- a real time-saver and one more way WebChart increases your productivity.
The image or data for a chart must be generated, and appropriate HTML tag(s) must be included in the client-side HTML. The server-side components produce charts as JPEG or PNG images, or (for ActiveX-aware browsers) as an .OC2/.OC3 file to be passed to a client- side copy of ComponentOne Chart. To make this simple yet flexible, a set of script functions to generate tags in the files 2DGENTAG.INC and 3DGENTAG.INC are provided. Functions are provided for both VBScript and JavaScript.
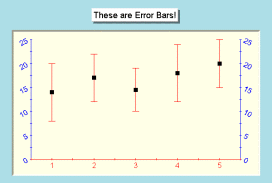
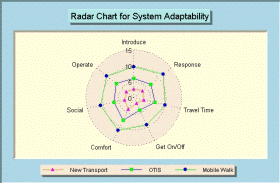
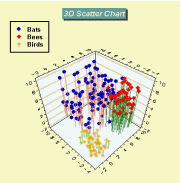
Demos: The WebChart demos Error Bars and Radar Chart (2D), and Scatter Chart (3D) provide more detailed examples of coding directly to an instance of the chart created using a method of the server-side components.
 |
|
 |
 |
Obtaining data from a database is often an important part of server-side charting. To simplify this process, direct processing of an ADO recordset is provided in the 2D ComponentOne Chart control. (Similar functionality is not available in the 3D control). The WebChart demo Recordset (ADO) (2D) shows a more detailed example of coding directly to an instance of the chart created using this new method.
