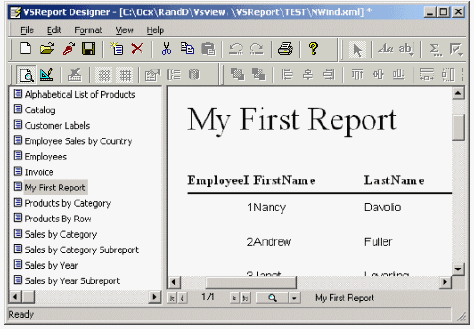
You can design your report to display your data in a variety of ways on the printed page. Using the VSReport8 Designer <wndreport_designer.htm>, you can design comprehensive lists, summaries, or special subsets of data, like an invoice.
![]()
The easiest way to start a new report is to use the Report Wizard. Click the New Report button on the main toolbar, or in the File menu, select New Report. The Report Wizard will appear, and will guide you through five easy steps.
-
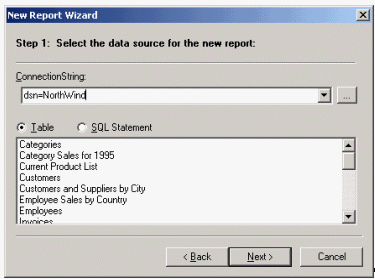
Select the data source for the new report
Use this page to select the ConnectionString and RecordSource that will be used to retrieve the data for the report.
You can specify the ConnectionString in three ways:
-
Type the string directly into the editor.
-
Use the drop down list to select a recently used connection string (the Designer keeps a record of the last eight connection strings).
-
Click the button with the ellipsis (…) to bring up the standard connection string builder.
You can specify the RecordSource string in two ways:
-
Click the Table button and a table from the list.
-
Click the SQL button and type (or paste) a SQL statement into the editor.
-
-
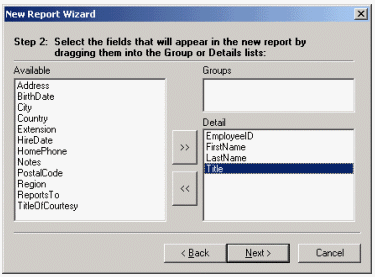
Select the fields you want to include in the report
This page contains a list of the fields available from the recordset you selected in Step 1, and two lists that define the group and detail fields for the report. Group fields define how the data will be sorted and summarized, and detail fields define what information you want to appear in the report.
You can move fields from one list to another by dragging them. Drag fields into the Detail list to include them in the report, or drag within the list to change their order. Drag fields back into the Available list to remove them from the report.
-
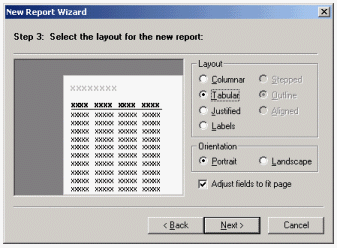
Select the layout for the new report
This page offers you several options to define how the data will be organized on the page. When you select a layout, a thumbnail preview appears on the left to give you an idea of what the layout will look like on the page. There are two groups of layouts, one for reports that have no groups and one for reports with groups. Select the layout that best approximates what you want the final report to look like.
This page also allows you to select the page orientation and whether fields should be adjusted to fit the page width.
The Labels layout option is used to print Avery-style labels. If you select this option, you will see a page that prompts you for the type of label you want to print.
-
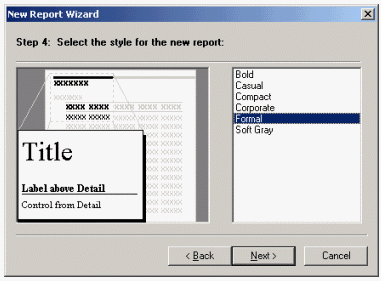
a) Select the style for the new report (not used for the Labels layout)

NOTE: If using the Labels layout, follow step 4b.
This page allows you to select the fonts and colors that will be used in the new report.Like the previous page, it shows a preview to give you an idea of what each style looks like.Select the one that you like best (and remember, you can refine it and adjust the details later).
b) Select the type of label you would like (for Labels layout only)
This page allows you to select the type of label you want to create. The Designer has over 170 predefined label types for you to choose from. The labels are divided into four groups, depending on whether they use metric or English measurements, and on the type of paper they use (sheets or continuous forms).
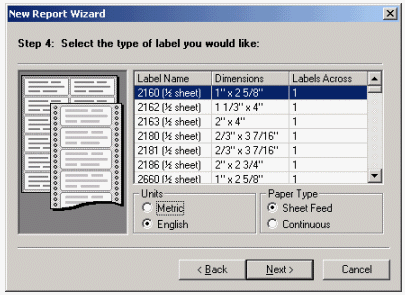
If the labels you want to print are not on the list, you can add your own custom types. To do so, you need to create a comma-delimited text file containing the information for the custom labels. This file should be called "LabelDef.txt" and it should be placed in the same directory where the Designer's executable (VSRpt8.exe) is located.
The label definition file should contain one line for each custom label type, and each line should contain the following 15 values, separated by commas. Lines starting with a semi-colon are treated as comments. Invalid label definitions (with missing or invalid data) are ignored.
ID
Label name.
DESCRIPTION
Description (usually includes the label dimensions).
ACROSS
Number of labels across a page.
METRIC
True for metric units, False for English (used to filter the display only).
WIDTH
Label width (all measurements in twips).
HEIGHT
Label height.
XSPACE
Horizontal space between labels.
YSPACE
Vertical space between labels.
MLEFT
Left page margin.
MRIGHT
Right page margin.
MTOP
Top page margin.
LMLEFT
Left label margin.
LMTOP
Top label margin.
CONTINUOUS
True for continuous forms, False for sheet-feed.
PORTRAIT
True for portrait page orientation, False for landscape.
For example, the following is a valid label definition:
Example Title Copy CodeCustom1,2 1/2" x 3 3/8",2,0,4860,3360,540,270,990,990,792,547,432,0,1
-
Select a Title for the new report
This last page allows you to select a title for the new report and to decide whether you would like to preview the new report right away or whether you would like to go into edit mode and start improving the design before previewing it.
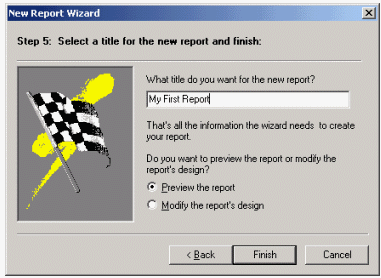
If you choose to preview the report and click finish, you will immediately see the report in the preview pane of the Designer. It should look like this: