Using ContourStyles
The attributes that define how contour lines and zoning colors look in the chart are called a ContourStyle. The chart has a built-in set of 100 styles. A subset of these styles are used for the chart display, based on the number of contour levels in the chart. You can load and save sets of ContourStyles and customize individual styles.
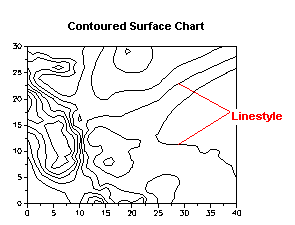
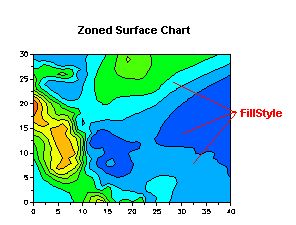
Every ContourStyle has a FillStyle and a LineStyle. FillStyles are used for zoning colors. LineStyles are used for contour lines. Most charts will not need to customize ContourStyles. Situations where you will need to customize them include:
· When it is important in your chart to control the precise ContourStyle for any particular level;
· When you need to display more than 100 levels; or
· When you want to uniquely identify contour lines. The built-in styles use the same LineStyle for every ContourStyle.
 FillStyle