Surface Tab (ChartGroup)
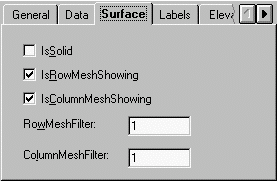
When selected (checked), the IsSolid checkbox sets the IsSolid property so that 3D surface charts display a solid skirt around the data.
Chart3D.ChartArea.Surface.IsSolid
When selected (checked), the IsRowMeshShowing checkbox sets the IsRowMeshShowing property so that the chart displays the row mesh when ChartGroup IsMeshed property is used.
Chart3D.ChartArea.Surface.IsRowMeshShowing
When selected (checked), the IsColumnMeshshowing checkbox sets the IsColumnMeshShowing property so that the chart displays the column mesh when ChartGroup IsMeshed property is used.
Chart3D.ChartArea.Surface.IsColumnMeshShowing
The RowMeshFilter textbox specifies the amount to filter display of row mesh lines. When 0, the chart filters automatically. When greater than 0, the chart displays each nth mesh line.
The ColumMeshFilter textbox specifies the amount to filter display of column mesh lines. When 0, the chart filters automatically. When greater than 0, the chart displays each nth mesh line.
For more information, see Modifying the Surface Appearance.