Styles Page
The attributes that define how the contour lines and zoning colors look in a chart are called ContourStyles. This page lists the currently defined ContourStyles and allows you to modify them as required. You can modify each ContourStyle by highlighting a specific style in the left pane then choosing the inner tab and property you wish to change.
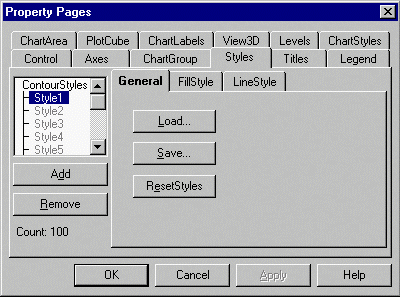
To add a new style, press the Add button. To remove a style, simply highlight the style you wish to delete and press the Remove button.
Chart3D.ChartGroups.Item(ii).Contour.Styles.Add
Chart3D.ChartGroups.Item(ii).Contour.Styles.Remove
For more information, see Using ContourStyles.
 General Tab (Styles)