Mesh Filtering
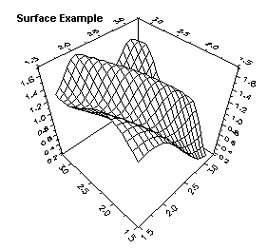
Use the ColumnMeshFilter and RowMeshFilter Surface properties to define how to filter the display of mesh lines. The chart can automatically determine the best filter, or you can specify a positive integer to use.
· When set to 0, the chart automatically determines the best filter based on the density of the mesh. As the chart data increases or the size of the chart control decreases, the chart performs more mesh filtering.
· When greater than 0, the chart provides fixed mesh filtering. Higher values cause fewer mesh lines to be drawn. For example, a value of 5 filters the mesh so that every fifth mesh line is drawn.
The ColumnMeshFilter and RowMeshFilter properties are located on the ChartGroup Surface Tab on the Property Pages.