Distribution Table Programming Considerations
Also, see Customizing the Distribution Table.
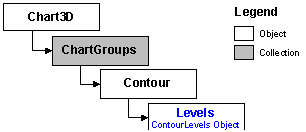
In 3D Chart, the ContourLevels object controls the behavior of the distribution levels used to create contour levels and zones for a chart. One ContourLevels object is defined for each chart group. The following is the object hierarchy for the ContourLevels object:
The NumLevels property of the ContourLevels object specifies the number of distribution levels to use in the chart. Any number between 0 and 100 is valid. If 0 is specified, no contour levels are drawn, and the entire chart is displayed as one zone.
By default, distribution levels are evenly spaced. To define your own distribution levels and spacing, use the Add method to create them. For example, the following code defines distribution levels at 1000, 2500 and 4200:
With Chart3D1.ChartGroups(1).Contour.Levels
.Add 1000#
.Add 2500#
.Add 4200#
End With
To remove a distribution level, use the Remove method:
Chart3D1.ChartGroups(1).Contour.Levels.Remove 1000#
A list of distribution levels can also be saved to a file using the Save method, and reloaded from a file using the Load method.
At any time, you can revert to evenly spaced distribution levels by setting the IsDefault property to True. The number of distribution levels in the chart will not change when you do this.
 Distribution Levels and Contour Styles