Data Tab (ChartGroup)
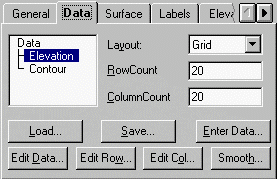
The Layout dropdown specifies the format of the chart data.
Note: Changing Layout deletes any data displayed in the chart.
Chart3D.ChartGroups.Item(ii).ElevationData.Layout
Chart3D.ChartGroups.Item(ii).ContourData.Layout
The RowCount textbox specifies the number of rows in the data grid.
Chart3D.ChartGroups.Item(ii).ElevationData.RowCount
Chart3D.ChartGroups.Item(ii).ContourData.RowCount
The ColumnCount textbox specifies the number of columns in the data grid.
Chart3D.ChartGroups.Item(ii).ElevationData.ColumnCount
Chart3D.ChartGroups.Item(ii).ContourData.ColumnCount
The Load button allows you to load new elevation or contour data.
Chart3D.ChartGroups.Item(ii).ElevationData.Load
Chart3D.ChartGroups.Item(ii).ContourData.Load
The Save button allows you to save the current elevation or contour data to a file.
Chart3D.ChartGroups.Item(ii).ElevationData.Save
Chart3D.ChartGroups.Item(ii).ContourData.Save
The Enter Data allows you to enter or edit data.
The Edit Data button allows you to edit the 3D chart data in the Edit Chart 3D Data window.

The Edit Row button allows you to edit the spacing delta between each row.
The Edit Col button allows you to edit the spacing delta between each column.
The Smooth button allows you to use a center-weighted averaging function to “smooth” the data.
Chart3D.ChartGroups.Item(ii).ElevationData.Smooth
Chart3D.ChartGroups.Item(ii).ContourData.Smooth
For more information, see Understanding Data Layout and Data Overview.
 Edit Chart 3D Data