Customizing ContourStyles
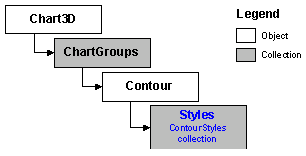
By default, the chart defines an array of contour styles for each chart group. These contour styles are specified as a ContourStyles collection of objects. The following is the object hierarchy for the ContourStyles collection:
Each ContourStyle object in this collection defines two properties which specify the appearance of a particular contour line or zone in a chart:
· The FillStyle property is a FillStyle object, and specifies the color of the zone associated with this contour style.
· The LineStyle property is a LineStyle object, and specifies the width, color and pattern of the contour line associated with this contour style. By default, each line is one pixel wide and is a solid black line.
A total of 100 contour styles are defined by default. To add additional contour styles, use the Add method.
 Contour Styles and Distribution Levels