Creating 4D Charts
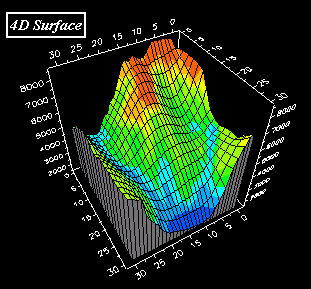
A 4D chart uses color to display a fourth dimension of data on a 3D surface or bar chart. The colors come from a second set of data that the chart uses for the zoning and contouring colors. 4D charts are useful for visualizing two sets of identically-sized data in one chart.
 Creating a 4D Chart