Contour and Zone Projection
The contours and zones determined for the chart can be displayed on the ceiling or the floor of the plot cube. To do this, set the IsContoured and/or the IsZoned property for the ceiling or the floor.
For example, the following statement projects zones onto the ceiling of the plot cube:
Chart3D1.ChartArea.PlotCube.Ceiling.Projection.IsZoned = True
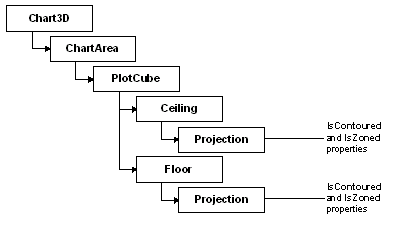
The following is the complete object hierarchy for contour and zone projection on the plot cube ceiling or floor:
The contour and zone settings used in these projections are set by the Contour object defined for that chart group.
Contour and zone projection are ignored in two-dimensional charts and bar charts.