Attaching the ChartLabel
Chart labels can be attached to a chart in one of three ways:
· at a particular grid index
· to a point in 3D space
· to pixel coordinates on the chart
To attach a chart label to a particular grid index, set the AttachMethod property to oc3dAttachDataIndex, and then set the AttachDataIndex property to the index values for that particular grid location. For example, the following attaches a chart label to the point at the second row and third column:
With Chart3D1.ChartLabels(1)
.AttachMethod = oc3dAttachDataIndex
.AttachDataIndex.Row = 2
.AttachDataIndex.Column = 3
End With
To attach a chart label to a point in 3D space, set the AttachMethod property to oc3dAttachDataCoord, and then set the AttachDataCoord property to the coordinates of the value. For example, the following attaches a chart label to the point (1.1, 15.8, 4.3):
With Chart3D1.ChartLabels(1)
.AttachMethod = oc3dAttachDataCoord
.AttachDataCoord.X = 1.1
.AttachDataCoord.Y = 15.8
.AttachDataCoord.Z = 4.3
End With
To attach a chart label to pixel coordinates on the chart, set the AttachMethod property to oc3dAttachCoord, and then set the AttachCoord property to the desired pixel coordinates. For example, the following attaches a chart label to the pixel coordinates (100, 100):
With Chart3D1.ChartLabels(1)
.AttachMethod = oc3dAttachCoord
.AttachCoord.X = 100
.AttachCoord.Y = 100
End With
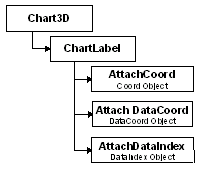
The following is the object hierarchy for the ChartLabels collection and the properties described above: