Attaching and Positioning ChartLabels
When you define a ChartLabel, you need to specify how and where to attach it to the chart.
The attachment method determines the basic appearance of the ChartLabel. The best method depends on what you are using the ChartLabel for. The following illustrates and describes the attachment methods:
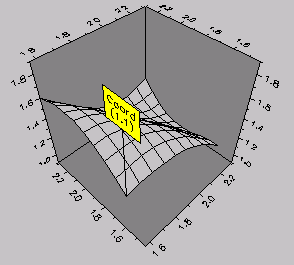
· Coordinates attaches outside the PlotCube and can appear anywhere on the chart. You specify the number of pixels from the top-left corner of the chart to the center of the ChartLabel. When attached this way, customizing the facing plane and cube font has no effect, however, vertical and horizontal offsets may be specified.
· DataCoordinates attaches inside the PlotCube to any point in 3D space within the data range. You specify the data X, Y, and Z coordinates. When attached this way, customizing the border and the font has no effect. Note that the chartlabels must fall within the maximum and minimum data coordinates for the axes, otherwise the label is not drawn. If the chart display is a 2D projection, then the HorizontalOffset and VerticalOffset properties are applied when positioning the ChartLabel.
· DataIndex attaches inside the PlotCube to a specific data point on the chart. You specify the row and column indices. When attached this way, customizing the border and the font has no effect. If the chart display is a 2D projection, then the HorizontalOffset and VerticalOffset properties are applied when positioning the ChartLabel.
Use the AttachMethod ChartLabel property to set the attachment method, and the AttachCoord, AttachDataCoord, or AttachDataIndex properties to set the attachment point. These properties are located on their own dialog on the AttachTab:ChartLabels on the Property Pages. Click the AttachMethod button to display the dialog.