The PointStyles Collection
The PointStyles collection contains the ChartStyles objects defined for each point. The behavior of the PointStyles collection is similar to that of the ChartStyles collection described above, except that the PointStyles collection is indexed by 2 variables, the series and point. When specifying the style for a single point in a series, the child objects make available an additional method called UseDefault that sets the style for the individual point to the style used by its series.
PointStyles for different Chart types
PointStyles can be set for these Chart types:
· For Plot, Bubble, Polar and Radar charts, point styles can be applied to the point style, size, and color.
· For Bar and Stacking Bar charts, point styles can be applied to the fill color and fill pattern of individual bars.
· For Pie charts, point styles can be applied to the fill color and fill pattern of individual pie slices, including the “other” slice.
· For HiLo, HiLoOpenClose, and Candle charts, all elements of their point styles can be altered.
Note: PointStyles cannot be applied to Area and Filled Radar Charts.
Examples
The following statement sets the color of the second bar in the first series in a chart to green.
Chart2D1.ChartGroups(1).PointStyles(1,2).Fill.Color = RGB(0,128,0)
The following sets the offset for the fourth slice in the third pie in a plot to 10% of the radius.
Chart2D1.ChartGroups(1).PointStyles(4,3).Slice.Offset = 10
The following sets the fill style for the second point in the third series to the default style used by the series:
Chart2D1.ChartGroups(1).PointStyles(4,3).Fill.UseDefault = True
The following is the object hierarchy for the ChartStyle and PointStyle objects and their children:
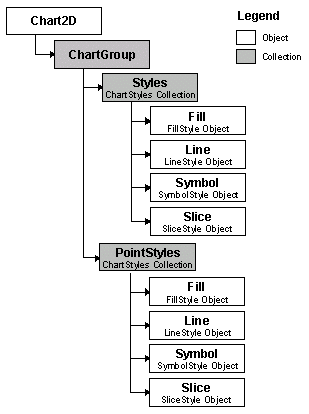
For more information, see the PointStyles Collection.