Negative values
For stacking bar charts, series with negative values are displayed below the X-axis, as is shown in the example below:
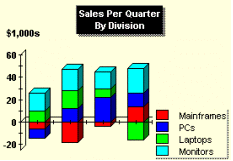
To modify the bar chart to show negative values, access the Property Pages and choose the ChartGroups tab. Choose the inner Data tab. You can choose the bar and series with the ThisPoint and ThisSeries properties. After choosing the correct bar and series, modify the value of the series by typing data into the Yvalue textbox.