Complex Candle Charts
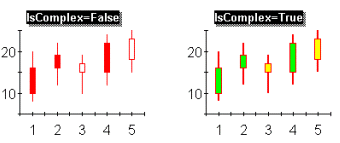
Use the candle IsComplex property to specify the type of candle chart drawn. Simple candle charts (IsComplex is False) are drawn with a filled candle to indicate a falling stock price (open was higher than close), and a hollow candle to indicate a rising stock price (close was higher than open). Complex candle charts are drawn with the Series2 FillStyle color to indicate a rising stock price, and the Series3 FillStyle color to indicate a falling stock price.
All candle properties are located on the ChartGroups Page Candle Tab.