Changing ChartStyles
The attributes that define how a series of data looks in the chart are called a ChartStyle. Each series has its own ChartStyle, which you can customize. For example, you can change the fill pattern and color of bars in a bar chart or the symbol used for data points in a plot or bubble chart.
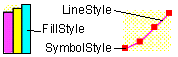
Every ChartStyle has a FillStyle, a LineStyle, a SymbolStyle, and a SliceStyle. FillStyles are used for bar, stacking bar, area and pie charts. LineStyles and SymbolStyles are used for plot and bubble charts. SliceStyles are used for pie charts.
 FillStyle