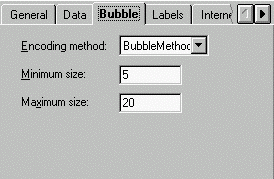
Bubble Tab (ChartGroups)
Use this tab to set Bubble chart properties. Note that in order to view this tab, the ChartType must be set to Bubble.

The EncodingMethod dropdown sets the size of the bubbles according to diameter or area. When specifying the size of the bubble, both the diameter and area are measured as a percentage of the total diameter or area of the plot area. Inverting these values (making the Minimum value larger than the Maximum) draws large bubbles for small values, and small bubbles for large values.
Chart2D.ChartArea.Bubble.EncodingMethod
The Minimum size textbox specifies minimum allowable size of the bubbles.
Chart2D.ChartArea.Bubble.MinimumSize
The Maximum size textbox specifies maximum allowable size of the bubbles.
Chart2D.ChartArea.Bubble.MaximumSize
For more information, see Bubble Charts.