FlexChart screen is used to visualise a list of items in a variety of chart types. The screen enables you to add customizable charts to your application. Depending on the type of data you need to display, you can represent your data in column, bar, scatter, bubble, line, and area charts, to name a few, or a combination of these. On moving mouse over a chart element, tooltip appears that shows details about the data point.
Properties panel in Visual Studio can be used to set the properties for the control in design view. For example, use default property editor to adjust the control's size, position of label for the display name, or default color palette to set colors for each series in the control. However, ComplexPropertyEditor is used to edit complex properties such as HeaderStyle, FooterStyle, or DataLabel.
You can include multiple series in one chart to compare items across different categories. Control the appearance and behavior of X and Y axes through AxisX and AxisY properties respectively. Header and footer styles for charts can also be customized as per users requirements.
This section describes how to use Wijmo FlexChart Screen template and add data.
This topic comprises of three steps:
Step 3: Build and Run the Project
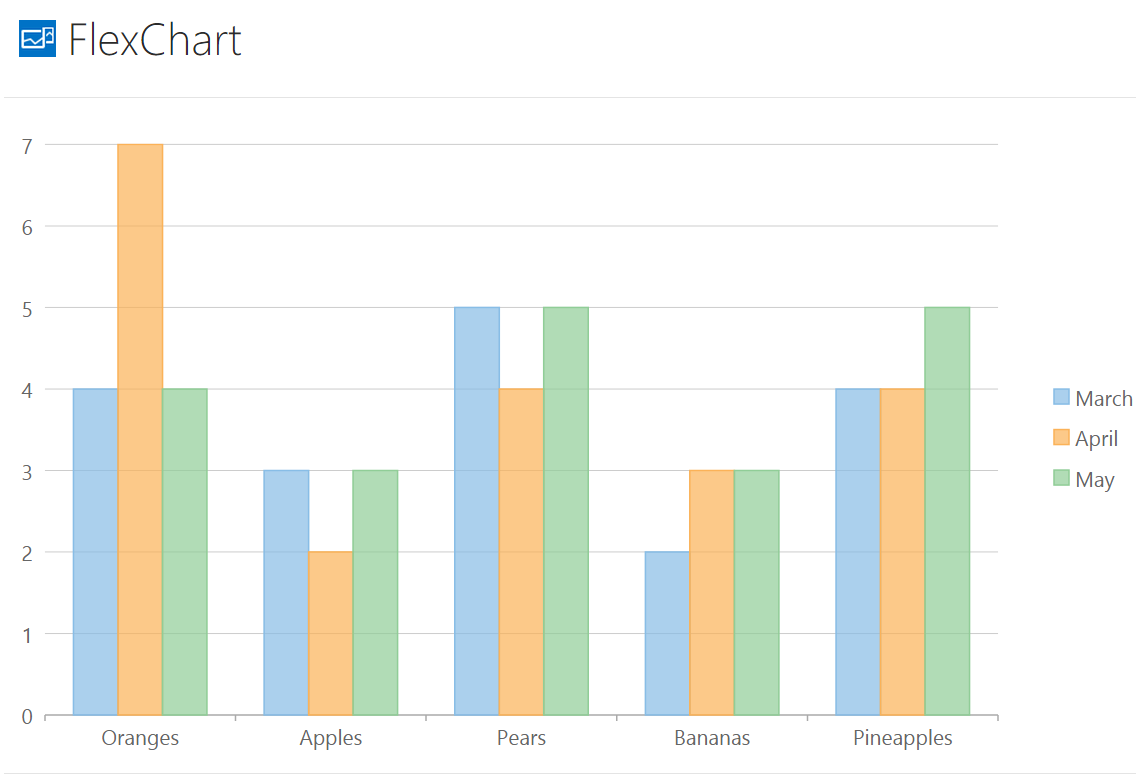
The following image shows how the FlexChart appears after completing the steps above:
Step 1: Add a Screen
- In the Solution Explorer, right click the client folder of your application (for example: Application1.HTMLClient) and click 'Add Screen...'.
- The Add New Screen dialog appears, select the screen template named Wijmo FlexChart Screen for your application.
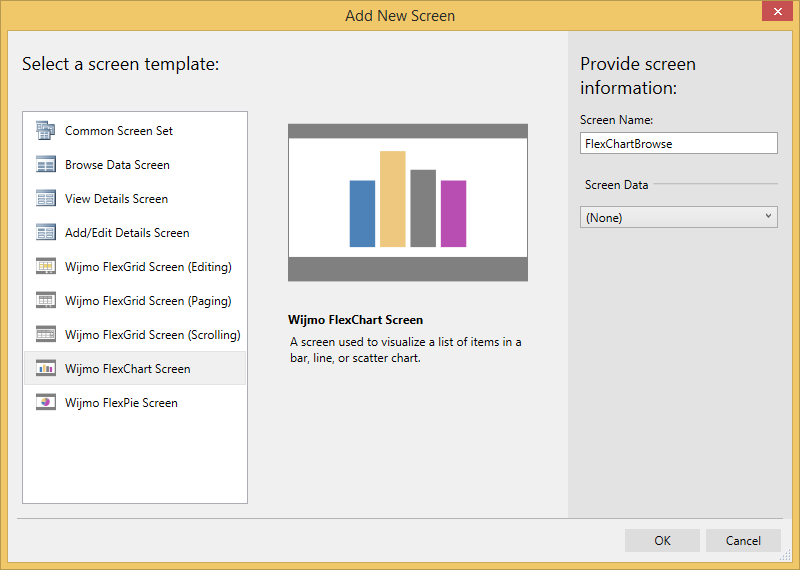
- Under Provide screen information, enter a name (for example:
FlexChartBrowse) for the screen in Screen Name text box.
Step 2: Add Data to Screen
The example uses data from local database file ApplicationData.mdf.
- Under Screen Data within Provide screen information section of Add New Screen dialog, click the drop-down arrow.
- A list of tables appears. Select ApplicationData.Fruits.
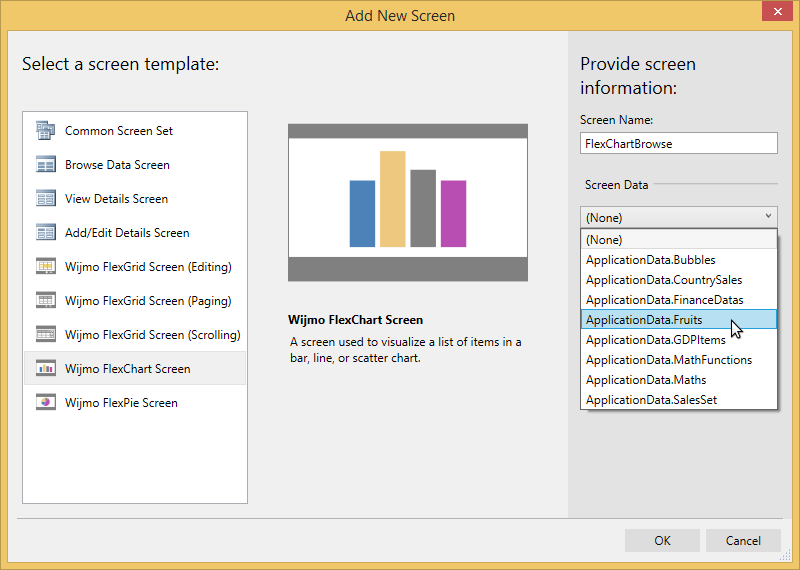
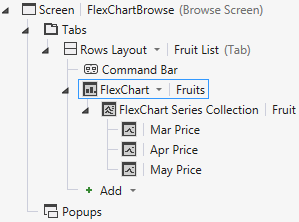
- Click OK. The screen, FlexChartBrowse.lsml is added to your application
- FlexChartBrowse.lsml page is added to the project under Screens folder, and the screen appears as shown in the image below:
Step 3:Build and Run the Project
- Click Build | Build Solution to build the project.
- Press F5 to run the project.