You can add multiple series to your charts and set a different ChartType for all the series. Such charts are helpful in analyzing complex chart data on a single canvas. The same data can be used with different visualizations or related data can be displayed together to convey trends.
The following image shows a FlexChart with multiple series.
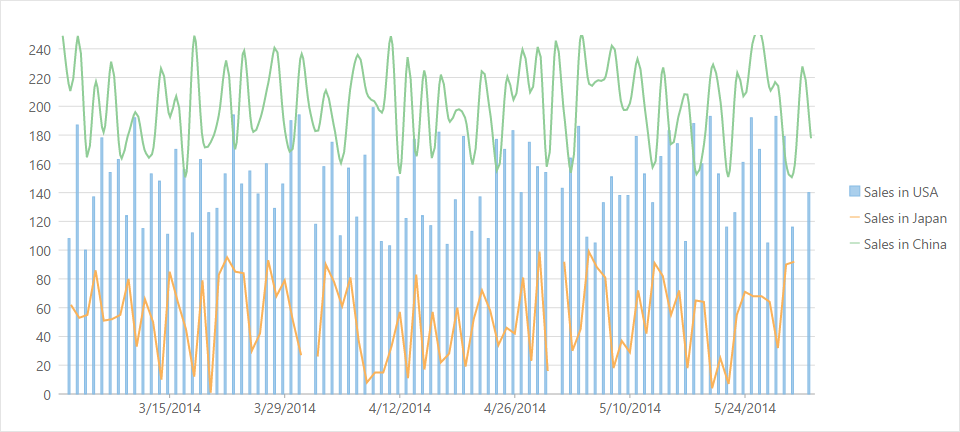
The following code example demonstrates how to add multiple chart series with different ChartTypes to the FlexChart.
| Razor |
Copy Code
|
|---|---|
// Initialize FlexChart @(Html.C1().FlexChart() .Bind("Date", Model) //Add Series to the chart .Series(sers => { //Add the first series sers.Add() .Binding("SalesInUSA") .Name("Sales in USA") .ChartType(C1.Web.Mvc.Chart.ChartType.Column); //Add the second series sers.Add() .Binding("SalesInJapan") .Name("Sales in Japan") .ChartType(C1.Web.Mvc.Chart.ChartType.Line); //Add the third series sers.Add() .Binding("SalesInChina") .Name("Sales in China") .ChartType(C1.Web.Mvc.Chart.ChartType.Spline); }) ) |
|