This topic describes local data binding of the control using the data option and bind attribute of the seriesList option. The code below shows temperature variation for different months of a year.
In Source View
Complete the following steps:
- Navigate to the Solution Explorer, expand the Shared folder inside the Views folder, and double-click _Layout to open the file.
- Add the following reference within the <head></head> tags:
<!--RequireJs--> <script type="text/javascript" src="http://cdn.wijmo.com/external/require.js"></script> <script type="text/javascript"> requirejs.config({ baseUrl: "http://cdn.wijmo.com/amd-js/3.20143.59", paths: { "jquery": "jquery-1.11.1.min", "jquery-ui": "jquery-ui-1.11.0.custom.min", "jquery.ui": "jquery-ui", "jquery.mousewheel": "jquery.mousewheel.min", "globalize": "globalize.min" } }); </script> - Add the following script between the <head></head> tags to create an object array, initialize the widget and add data to the wijsparkline.
<script id="scriptInit" type="text/javascript">
require(["wijmo.wijsparkline"], function () {
    $(document).ready(function () {
        var data = [{ name: "Januray", score: 73 }, { name: "February", score: 95 }, { name: "March", score: 89 },
            { name: "April", score: 66 }, { name: "May", score: 50 }, { name: "June", score: 65 },
            { name: "July", score: 70 }, { name: "August", score: 43 }, { name: "September", score: 65 },
            { name: "October", score: 27 }, { name: "November", score: 77 }, { name: "December", score: 58 }];
        $("#wijsparkline").wijsparkline({
            data: data,
            seriesList: [{
                bind: "score"
            }]
        });
    });
});
</script>
- Add the following markup within the <body></body> tags of the page, just after @RenderBody() to create the wijsparkline widget.
<div id="wijsparkline" style="height:50px;width:200px" />
- Press F5 to run the project.
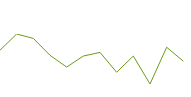
What You've Accomplished
The wijsparkline will appear as shown in the image below, with the bound values showing in a simple spark line: