In this step you will run the application and observe the new data and char elements that include titles for the X and Y axis, Chart header, and chart labels.
- Press F5 to run the application.
- Observe the following:
- Hover over any of the chart series and notice a tooltip appears stating the value of the label property, and the Y value of that series.
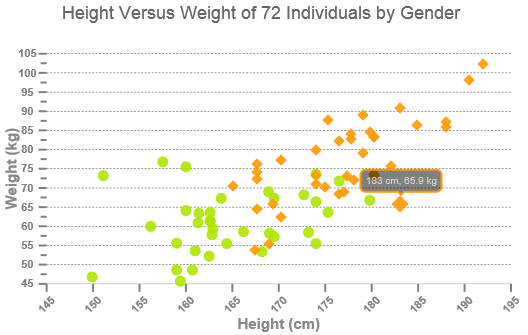
The tooltip appears when the following code is used:
hint: { content: function () { return this.data.label + '<br/> ' + this.y + ''; } }, - Notice the title for the chart header appears when we used the following code:
header: { text: "Hardware Distribution" }, - The three data series appear with string X data and numerical Y data. The following code is used to achieve the result:
seriesList: [ { label: "Female", legendEntry: true, data: { x: [161.4, 169.0, 166.2, 159.4, 162.5, 159.0, 162.8, 159.0, 179.8, 162.9, 161.0, 151.1, 168.2, 168.9, 173.2, 174.0, 162.6, 174.0, 162.6, 161.3, 156.2, 149.9, 169.5, 160.0, 175.3, 169.5, 160.0, 172.7, 162.6, 157.5, 176.5, 164.4, 160.7, 174.0, 163.8], y: [63.4, 58.2, 58.6, 45.7, 52.2, 48.6, 57.8, 55.6, 66.8, 59.4, 53.6, 73.2, 53.4, 69.0, 58.4, 73.6, 61.4, 55.5, 63.6, 60.9, 60.0, 46.8, 57.3, 64.1, 63.6, 67.3, 75.5, 68.2, 61.4, 76.8, 71.8, 55.5, 48.6, 66.4, 67.3] }, visible: true, markerType: "circle" }, { label: "Male", legendEntry: true, data: { x: [175.0, 174.0, 165.1, 177.0, 192.0, 176.5, 169.4, 182.1, 179.8, 175.3, 184.9, 177.3, 167.4, 178.1, 168.9, 174.0, 167.6, 170.2, 167.6, 188.0, 174.0, 176.5, 180.3, 167.6, 188.0, 180.3, 167.6, 183.0, 183.0, 179.1, 170.2, 177.8, 179.1, 190.5, 177.8, 180.3, 180.3 ], y: [70.2, 73.4, 70.5, 68.9, 102.3, 68.4, 65.9, 75.7, 84.5, 87.7, 86.4, 73.2, 53.9, 72.0, 55.5, 70.9, 64.5, 77.3, 72.3, 87.3, 80.0, 82.3, 73.6, 74.1, 85.9, 73.2, 76.3, 65.9, 90.9, 89.1, 62.3, 82.7, 79.1, 98.2, 84.1, 83.2, 83.2 ] }, visible: true, markerType: "diamond" } ], - The Y-Axis title, “Total Hardware” is applied to the Scatter chart and the X-Axis title as an empty string. The following code is used to achieve the result:
axis: {
                y: {
                    text: "Total Hardware"
                },
                x: {
                    text: ""
                }
            },
- Hover over any of the chart series and notice a tooltip appears stating the value of the label property, and the Y value of that series.
See Also