Use this screen to visualize a list of items in a pie chart.
In order to use this screen template, you must first install the NuGet package into the HTML Client project. See Installing the NuGet Client Package for instructions.
The order of the collection properties under the Columns Layout element determines how the chart plots data. (Unlike the Wijmo Chart Screen, the visibility of collection properties is ignored.) The first property is interpreted as the set of data points (pie slices) to be listed in the chart legend. The second property provides the numeric values that determine the relative sizes of the pie slices.
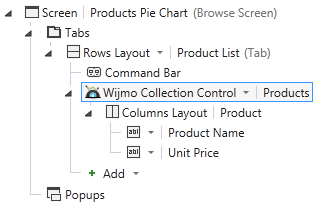
In the preceding figure, one pie slice is created for each collection item (labeled according to the first property, Product Name), and the size of each slice is determined by the value of Unit Price. At runtime, this results in a pie chart similar to the following:
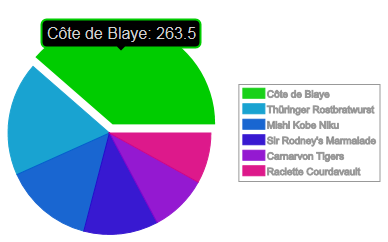
The generated script code specifies a number of default settings that you can easily change. For example, the default width and height is 400 pixels, the legend is visible, and the pie slices display a label as shown in the preceding figure when tapped (on a touch device) or pointed to (on a desktop browser). Also, the screen template uses a gray text color by default so that the chart is readable in both the light and dark themes. You can modify this color value in code if desired.
 |
Since there are semantics associated with the order of the collection properties, this screen template may not work as expected until those properties are rearranged in the layout tree. |