Use this screen to build pivot tables and charts for an entity or query.
In order to use this screen template, you must first install the NuGet package into the HTML Client project. See Installing the NuGet Client Package for instructions. In addition, you must install and configure the NuGet package named OLAP Server for LightSwitch. See Installing the NuGet Server Package for instructions.
Unlike the other screen templates, the Wijmo OLAP Screen derives its data from a Web API controller instead of a screen collection property. When you instantiate this template, the data source you specify is not used to populate a grid or chart directly, but is used to present several lists of fields to the user in a popup element, which is shown when the user clicks the Settings command button. The order of the collection properties in the layout tree determines the order in which fields are shown to the user. You can delete properties in the designer that you don’t want the user to see.
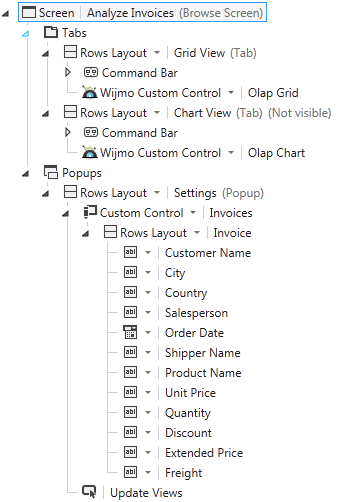
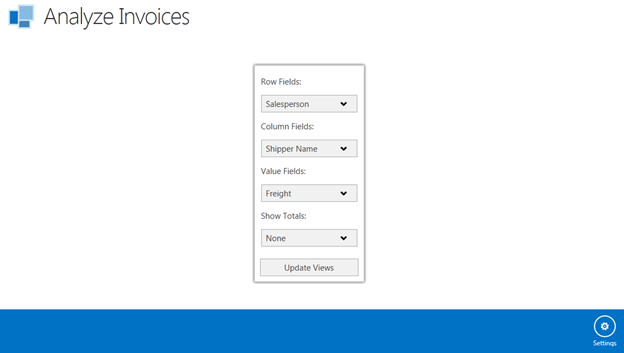
At runtime, the screen tabs are blank until the user clicks the Settings button to show the popup, then selects a row field and a value field, and then clicks the Update Views button to request data from the Web API controller. Setting the column field is not required. The selections made in the popup are appended as a query string to the URL for the Web API controller.
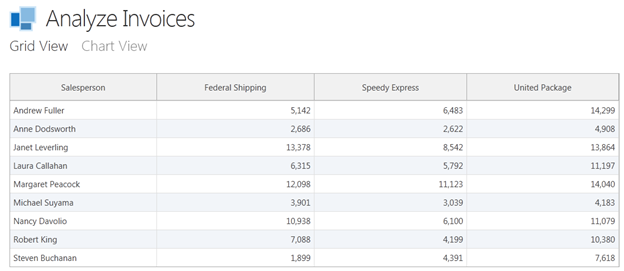
In this example, the Web API controller creates a DataTable containing one row for each distinct Salesperson and one column for each distinct Shipper Name. Each numeric data value represents the aggregate (sum) of the Freight values for distinct row/column pairs. The DataTable is converted to a JSON string and returned to the client, which renders the result in a grid.
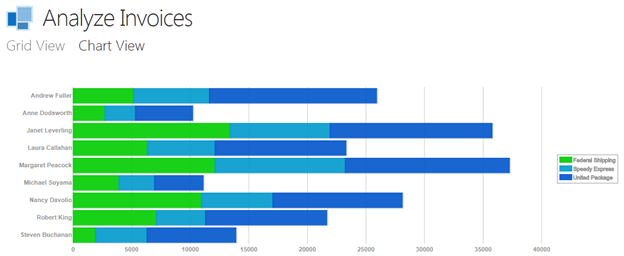
Now the screen tabs are visible, and clicking the Chart View tab re-renders the result as a horizontal bar chart without invoking the Web API controller.
The Settings popup also contains an option for displaying row and/or column totals. By default, totals are not displayed. In the preceding example, changing the Show Totals setting from None to All produces the following grid display: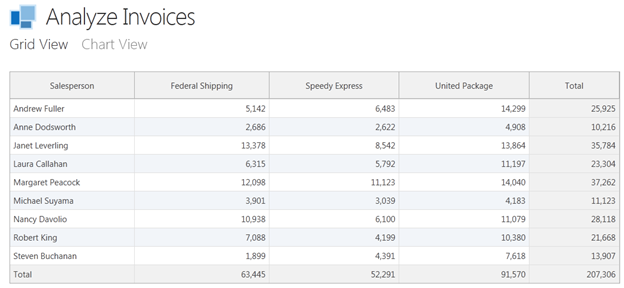
Note that the Show Totals setting has no effect on the chart display.
To specify an initial view for the user when the screen first loads, edit the screen code and change the default string values in the screen’s created method. For example, to produce the display shown in the preceding figure, set the initial field names to the corresponding screen collection property names (not the display names with embedded spaces). By default, these are empty strings, and nothing will be displayed until the user interacts with the Settings popup. To generate totals for both rows and columns, change the value of the screen property ShowTotals from none to all.
The modified function should now look like this:
| C# |
Copy Code
|
|---|---|
myapp.AnalyzeInvoices.created = function (screen) {

    // Replace with the relative URL for your Web API, if different
    baseUrl = "../API/Olap/";

    // Set initial field names for preloading an OLAP view
    screen.RowField = "Salesperson";
    screen.ColumnField = "ShipperName";
    screen.ValueField = "Freight";

    // Set display of grand totals (none, rows, columns, all)
    screen.ShowTotals = "all";
};
|
|