Use this screen to visualize a list of items in a bar, line, or scatter chart.
To use this screen template, you must first install the NuGet package into the HTML Client project. See Installing the NuGet Client Package for instructions.
The order and visibility of the collection properties under the Columns Layout element determine how the chart plots data. The first visible property is interpreted as the set of data points (labels) to be plotted along the X-axis. The remaining visible properties represent one or more data series containing numeric values to be plotted along the Y-axis.
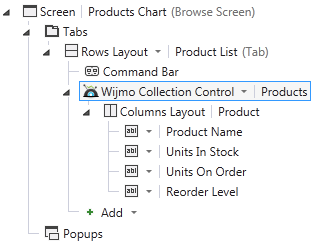
In the preceding figure, one data point is created for each collection item (labeled according to the first property, Product Name), and three data series are plotted in the Y-axis (Units In Stock, Units On Order, Reorder Level). At runtime, this results in a bar chart similar to the following:
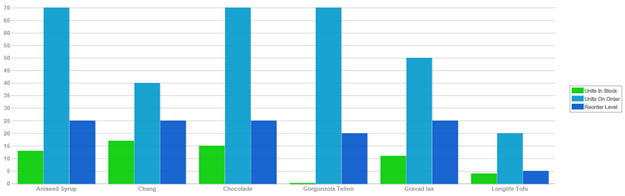
The generated script code specifies a number of default settings that you can easily change. For example, the default height is 400 pixels, the legend is visible, the bars are not stacked, and the orientation is vertical. Also, the screen template uses a gray text color by default so that the chart is readable in both the light and dark themes. You can modify this color value in code if desired.
 |
Since there are semantics associated with the order of the collection properties, this screen template may not work as expected until those properties are rearranged in the layout tree. |