FlexGrid for WinForms supports displaying the sparklines in FlexGrid columns. Now, the flexgrid control can have bound as well as unbound columns. This walkthrough will take you through the steps to display the sparklines in bound and unbound columns of the grid after setting up the grid and populating data in it.
The topic is divided into following three steps:
Step 1: Set up the grid and populate data
- Create a new Windows Forms application.
- Drag and drop C1FlexGrid control from the Toolbox onto your form.
- From the Properties window, set its Dock property to Fill.
- In the Form1.cs file, define a method to create a DataTable. The DataTable will be used as the DataSource for the FlexGrid control.
Copy Codeprivate void InitDataTable() { _dataTable = new DataTable(); _dataTable.Columns.Add("Region", typeof(String)); _dataTable.Columns.Add("Monthly Sales Trend", typeof(Array)); _dataTable.Columns.Add("Q1 Sales", typeof(double)); _dataTable.Columns.Add("Q2 Sales", typeof(double)); _dataTable.Columns.Add("Q3 Sales", typeof(double)); _dataTable.Columns.Add("Q4 Sales", typeof(double)); string[] regions = {"North","South","East","West" }; Random random = new Random(); for (int i = 0; i < regions.Length; i++) { double[] monthlySales = new double[12]; double[] quaterlySales = new double[4]; for (int j=0;j<12;j++) { monthlySales[j]= random.Next(0,1000); quaterlySales[j / 3] += monthlySales[j]; } _dataTable.Rows.Add(new object[] { regions[i], monthlySales,quaterlySales[0], quaterlySales[1], quaterlySales[2], quaterlySales[3] }); } }
- To populate data, bind the FlexGrid control to the datatable and other styling properties.
Copy Codeprivate void SetUpGrid() { //Bind FlexGrid c1FlexGrid1.DataSource = _dataTable; //Setting additional properties of the FlexGrid c1FlexGrid1.Cols.Fixed = 0; c1FlexGrid1.Font = new Font("Microsoft Sans Serif", 10f, FontStyle.Regular); c1FlexGrid1.Cols.DefaultSize = 140; c1FlexGrid1.Rows.DefaultSize = 50; for (int col = 0; col < c1FlexGrid1.Cols.Count; col++) { c1FlexGrid1.Cols[col].TextAlign = TextAlignEnum.CenterCenter; c1FlexGrid1.Cols[col].TextAlignFixed = TextAlignEnum.CenterCenter; } c1FlexGrid1.Cols["Monthly Sales Trend"].StyleNew.Margins = new System.Drawing.Printing.Margins(10, 10, 5, 5); c1FlexGrid1.Cols["Q1 Sales"].Format = "c2"; c1FlexGrid1.Cols["Q2 Sales"].Format = "c2"; c1FlexGrid1.Cols["Q3 Sales"].Format = "c2"; c1FlexGrid1.Cols["Q4 Sales"].Format = "c2"; c1FlexGrid1.Styles.Alternate.BackColor = Color.FromArgb(213, 227, 228); }
Step 2: Show sparkline in bound column
- To show sparkline in a bound column (named 'Monthly Sales Trend' in this case), set the ShowSparkline property of this column to 'true' in Form_Load event.
- (Optional) To highlight the highest datapoint of the sparkline, set the ShowHigh property of Sparkline class to 'true'.
Copy Code//Show sparklines in a bound column, //'Monthly Sales Trend' is a column of Array type, hence setting the ShowSparkline property to true shows //the sparklines in this column c1FlexGrid1.Cols["Monthly Sales Trend"].ShowSparkline = true; c1FlexGrid1.Cols["Monthly Sales Trend"].Sparkline.ShowHigh = true;
Run the application and observe how Line sparkline is displayed in the bound column of FlexGrid.
Step 3: Show sparkline in unbound column
- Add an unbound column (named 'Quarterly Profit' in this case) to the grid to show the sparklines.
Copy CodeColumn unboundCol = c1FlexGrid1.Cols.Add(); unboundCol.Caption = "Quarterly Profit"; unboundCol.Name = "Quarterly Profit"; unboundCol.TextAlign = TextAlignEnum.CenterCenter; unboundCol.TextAlignFixed = TextAlignEnum.CenterCenter; unboundCol.StyleNew.Margins = new System.Drawing.Printing.Margins(10, 10, 5, 5); unboundCol.AllowEditing = false; //Disable editing in the unbound column which shows the sparklines
- To show sparkline in the unbound column, set the ShowSparkline property of this column to 'true' and set few other properties as required. This example displays a Winloss sparkline in this case by setting the SparklineType property.
Copy Code//Set properties to display WinLoss Sparkline in unbound column unboundCol.ShowSparkline = true; unboundCol.Sparkline.SparklineType = SparklineType.WinLoss; unboundCol.Sparkline.Styles.SeriesColor = Color.Green; unboundCol.Sparkline.ShowNegative = true;
- Bind the GetUnboundValue to provide data for the unbound column.
Copy Codec1FlexGrid1.GetUnboundValue += C1FlexGrid1_GetUnboundValue;
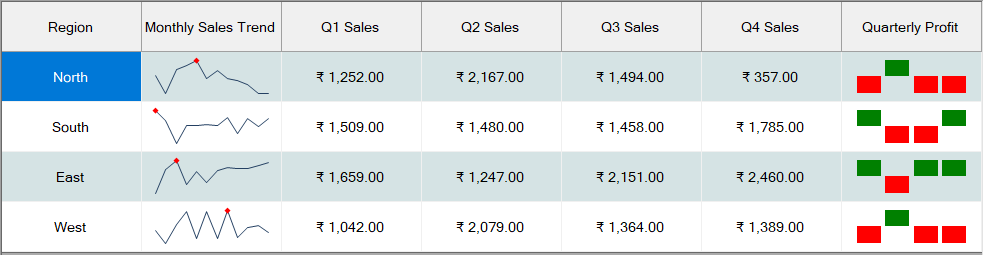
Here is the code for the event handler which generates the data for "Quarterly Profit" column on the basis of quarterly data generated in Step 1: Set up the grid and populate data.Copy Code//Provide the data for the Sparkline in the GetUnboundValue event handler private void C1FlexGrid1_GetUnboundValue(object sender, UnboundValueEventArgs e) { if (c1FlexGrid1.Cols[e.Col].Name == "Quarterly Profit") { Row row = c1FlexGrid1.Rows[e.Row]; List<double> profitValues = new List<double>(); for (int i = 2; i < 6; i++) { //Compare and find the quarterly profit trend //If the quarterly sales value is greater than 1500 then quarter was in profit else loss. profitValues.Add(Convert.ToDouble(c1FlexGrid1.GetData(e.Row, i)) - 1500); } e.Value = profitValues; } }
Run the application and observe how Winloss sparkline gets displayed in the unbound column of FlexGrid.