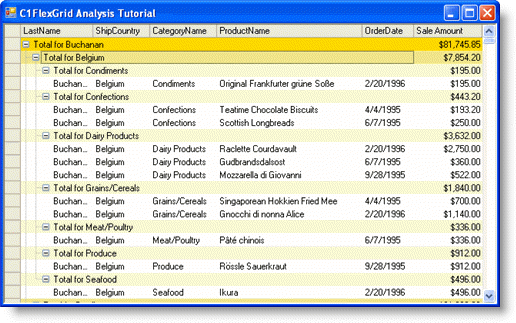
When the grid is used in bound mode, any changes to the data source cause the grid to fire the AfterDataRefresh event. This event is the ideal place to put the code that inserts the subtotals and builds the outline tree for the grid.
Add the following AfterDataRefresh event handler to the form:
To write code in Visual Basic
| Visual Basic |
Copy Code
|
|---|---|
Private Sub C1FlexGrid1_AfterDataRefresh(ByVal sender As Object, ByVal e As ListChangedEventArgs) Handles C1FlexGrid1.AfterDataRefresh

    ' Total the Sale Amount.
    Dim totalOn As Integer = C1FlexGrid1.Cols("Sale Amount").SafeIndex
    Dim caption As String = "Total for {0}"

     ' Calculate three levels of totals.
    C1FlexGrid1.Subtotal(AggregateEnum.Sum, 0, 1, totalOn, caption)
    C1FlexGrid1.Subtotal(AggregateEnum.Sum, 1, 2, totalOn, caption)
    C1FlexGrid1.Subtotal(AggregateEnum.Sum, 2, 3, totalOn, caption)

     ' Collapse the outline to level 2.
    C1FlexGrid1.Tree.Show(2)

     ' Autosize the grid to accommodate the tree.
    C1FlexGrid1.AutoSizeCols(1, 1, 1000, 3, 30, AutoSizeFlags.IgnoreHidden)
End Sub
|
|
To write code in C#
| C# |
Copy Code
|
|---|---|
private void c1FlexGrid1_AfterDataRefresh( object sender, ListChangedEventArgs e)
{
     // Total the Sale Amount.
     int totalOn = c1FlexGrid1.Cols["Sale Amount"].SafeIndex;
     string  caption = "Total for {0}";

     // Calculate three levels of totals.
    c1FlexGrid1.Subtotal(AggregateEnum.Sum, 0, 1, totalOn, caption);
    c1FlexGrid1.Subtotal(AggregateEnum.Sum, 1, 2, totalOn, caption);
    c1FlexGrid1.Subtotal(AggregateEnum.Sum, 2, 3, totalOn, caption);

     // Collapse the outline to level 2.
    c1FlexGrid1.Tree.Show(2);

     // Autosize the grid to accommodate the tree.
    c1FlexGrid1.AutoSizeCols(1, 1, 1000, 3, 30, AutoSizeFlags.IgnoreHidden);
}
|
|
Run the program and observe the following:
The code starts by getting the index of the Sale Amount column. In this tutorial, the index will always be the same (Column 6). Looking up the index is usually better than hardwiring it, though, because if someone added a couple of fields to the SQL statement the index would change.
The code then calls the C1FlexGrid.Subtotal method to group the data and insert new rows with the subtotals. The new rows are automatically configured as outline nodes (their IsNode property is set to True), so the subtotals are collapsible.

Try dragging columns around. You can easily see the totals by country, product category, or salesperson. You can also expand tree nodes to drill down into the data if you want to see more detail.

Note also that the grid is editable, changing some values in the Sale Amount column will cause the AfterDataRefresh event to fire again, and the totals will be automatically updated.
This concludes this tutorial.