The steps to plot a simple 2D chart are as follows:
- Open the C1FlexReportDesigner application.
- Create a new report by navigating through the C1FlexReport wizard or open an existing report definition.
- Add Legacy Chart field to the Detail section.
Note: To add Legacy Chart field to your report, you need to add it to the INSERT tab. In order to do that, go to File|Options in the designer and select Show "Legacy Chart" button on the INSERT tab.
- Right-click the chart field, select Chart Properties>Simple Types>Bar.
- Right-click the chart field and select Chart Data Source.
- Click Simple 2D Chart and check the Generate simple 2D chart checkbox.
- Specify X and Y values of the chart.
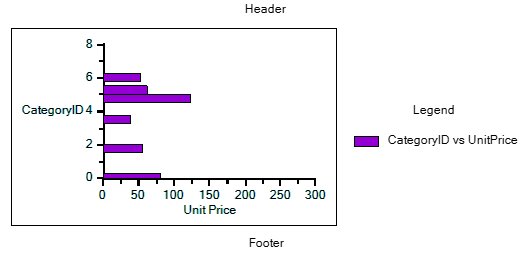
For example, the chart shown is created using C1NWind.mdb database and Products table, with following properties set:
- Chart Type as 'Bar'
- X and Y values of the chart as 'CategoryID' and 'UnitPrice', respectively.
Add series label as follows:
- Select 2D Chart Group0, and then Series Values.
- Specify Series Label as ''CategoryID vs UnitPrice'.
Add legend as follows:
- Go to the Properties window.
- In the Legend|Text, set the legend name as 'Legend' and Legend|Visible to True.
Add Titles to the chart as follows:
- Go to Properties window.
- Select Titles|Header, set the header text as 'Header' and Titles|Header|Visible to True.
- Select Titles|Footer, set the footer text as 'Footer' to add header and footer to the chart.
You can also add axis titles in the chart, add back color and border to chart area, and more. For more information on using properties for customizing charts, see 2DChart documentation.
Three dimensional data can be represented in the form of 3D Surface, 3D Bar, and many more by using 3D Chart types. To plot 3D charts from 2D charts, you can change the VisualizationType property to Chart3D. For more information on plotting 3D charts, see 3DChart documentation.