ComponentOne FlexChart for WinForms
Waterfall
FlexChart > Understanding FlexChart > FlexChart Types > Waterfall

Waterfall allows you to understand the cumulative effect of sequential positive or negative values. It is useful to understand the effect of a series of positive and negative values on an initial value. The series depicts color coded columns to easily distinguish positive values from negative values. Generally initial and final values are depicted by total columns, while intermediate values are represented by floating columns. It is recommended to use Waterfall series when there is a column of category text and a mix of positive and negative values. Such cases are mostly found in quantitative analysis like inventory analysis or performance analysis, where the chart shows the gradual transition in the quantitative value of an entity subjected to increment or decrement.

FlexChart provides features that can be implemented and customized for enhanced data visualization through Waterfall series. 

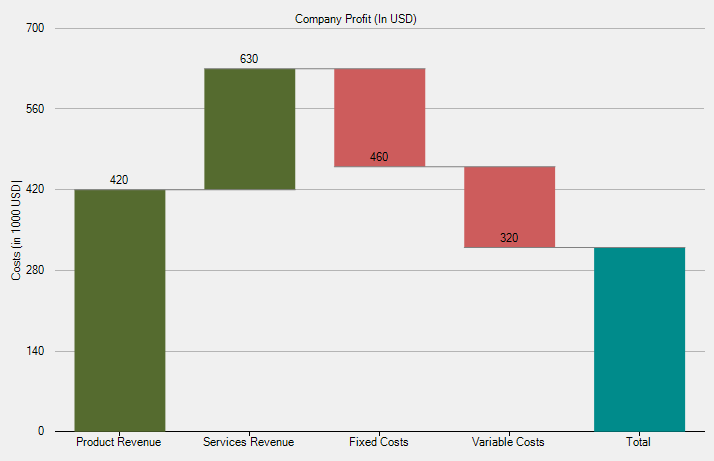
The following image displays Waterfall series displaying the cumulative effect of sequential positive and negative values.

To work with Waterfall series in FlexChart, create an instance of the Waterfall class, which inherits the Series class. Add the created instance to the FlexChart Series collection accessible through the Series property of the FlexChart class.

The following code snippet illustrates how to set various properties while working with Waterfall series in FlexChart.

' create a datatable
Dim dt As New DataTable("Product Comparison")

' add columns to the datatable
dt.Columns.Add("Costs", GetType(String))
dt.Columns.Add("Amount", GetType(Integer))

' add rows to the datatable
dt.Rows.Add("Product Revenue", 420)
dt.Rows.Add("Services Revenue", 630)
dt.Rows.Add("Fixed Costs", 460)
dt.Rows.Add("Variable Costs", 320)

' clear data series collection
FlexChart1.Series.Clear()

' create a Waterfall series
Dim waterFall As New C1.Win.Chart.Waterfall()

' add the Waterfall series to the FlexChart series collection
FlexChart1.Series.Add(waterFall)

' specify the datasource for the FlexChart
FlexChart1.DataSource = dt

' bind the X-axis
FlexChart1.BindingX = "Costs"

' bind the Y axes
waterFall.Binding = "Amount"

' customize WaterFall connector lines
waterFall.ConnectorLines = True
waterFall.ConnectorLineStyle.StrokeWidth = 0.5F
waterFall.ConnectorLineStyle.StrokeColor = Color.Gray
waterFall.ConnectorLineStyle.Stroke = Brushes.Gray

' customize styles for rising, falling, and total values
waterFall.RisingStyle.FillColor = Color.DarkOliveGreen
waterFall.FallingStyle.FillColor = Color.IndianRed
waterFall.ShowTotal = True
waterFall.TotalStyle.FillColor = Color.DarkCyan
waterFall.TotalLabel = "Total"

' specify titles for FlexChart header and axes
FlexChart1.Header.Content = "Company Profit (In USD)"
FlexChart1.AxisY.Title = "Costs (in 1000 USD)"

' customize axes
FlexChart1.AxisY.MajorUnit = 140
FlexChart1.AxisY.Min = 0
FlexChart1.AxisY.Max = 700

' customize data labels
FlexChart1.DataLabel.Content = "{Amount}"
FlexChart1.DataLabel.Position = C1.Chart.LabelPosition.Top
// create a datatable
DataTable dt = new DataTable("Product Comparison");

// add columns to the datatable
dt.Columns.Add("Costs", typeof(string));
dt.Columns.Add("Amount", typeof(int));

// add rows to the datatable
dt.Rows.Add("Product Revenue", 420);
dt.Rows.Add("Services Revenue", 630);
dt.Rows.Add("Fixed Costs", 460);
dt.Rows.Add("Variable Costs", 320);

// clear data series collection
flexChart1.Series.Clear();

// create a Waterfall series
C1.Win.Chart.Waterfall waterFall = new C1.Win.Chart.Waterfall();

// add the Waterfall series to the FlexChart series collection
flexChart1.Series.Add(waterFall);

// specify the datasource for the FlexChart
flexChart1.DataSource = dt;

// bind the X-axis
flexChart1.BindingX = "Costs";

// bind the Y axes
waterFall.Binding = "Amount";

// customize WaterFall connector lines
waterFall.ConnectorLines = true;
waterFall.ConnectorLineStyle.StrokeWidth = 0.5F;
waterFall.ConnectorLineStyle.StrokeColor = Color.Gray;
waterFall.ConnectorLineStyle.Stroke = Brushes.Gray;

// customize styles for rising, falling, and total values
waterFall.RisingStyle.FillColor = Color.DarkOliveGreen;
waterFall.FallingStyle.FillColor = Color.IndianRed;
waterFall.ShowTotal = true;
waterFall.TotalStyle.FillColor = Color.DarkCyan;
waterFall.TotalLabel = "Total";

// specify titles for FlexChart header and axes
flexChart1.Header.Content = "Company Profit (In USD)";
flexChart1.AxisY.Title = "Costs (in 1000 USD)";

// customize axes
flexChart1.AxisY.MajorUnit = 140;
flexChart1.AxisY.Min = 0;
flexChart1.AxisY.Max = 700;

// customize data labels
flexChart1.DataLabel.Content = "{Amount}";
flexChart1.DataLabel.Position = C1.Chart.LabelPosition.Top;