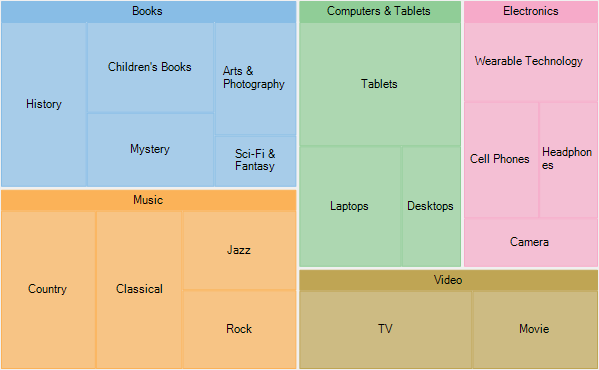
This quick start topic provides step-by-step instructions for adding a TreeMap chart to WinForms application, and show hierarchical data in it. In this topic, we consider an example where user wants to compare sales of books, music, videos, and gadgets (like computers and tablets) in XYZ city in a particular year.
The steps to display hierarchical data in TreeMap control are as follows:
- Step 1: Add TreeMap to project
- Step 2: Create a hierarchical data source
- Step 3: Bind the TreeMap to data source
- Step 4: Build and run the project
The following image exhibits and compares sales of different varieties of books, music, videos, and gadgets (like computers and tablets) in XYZ city in a particular year.

You need to set the DataSource property, of TreeMap class, to point to the collection of objects that contain data points to be plotted on the chart. To generate data items and display them in TreeMap chart, set BindingName and Binding properties. Set the BindingName property to the string value that specifies the name of the data item to display as chart rectangles, and Binding property to the string value that specifies the name of property of chart items that contain chart values (numeric values that help calculate the size of tree nodes).
To specify the level of hierarchical items to drill down and display in the chart set the MaxDepth property. Also, the display layout of the TreeMap is specified through its ChartType property. Additionally, color palette can be used to stylize the control and change its appearance.
Step 1: Add TreeMap to project
- Create a Windows Forms application in Visual Studio.
- Drag and drop TreeMap control from Toolbox to form.
The following DLL gets added to your application:
C1.Win.FlexChart.4.dll
Step 2: Create a hierarchical data source
Switch to the code view and add the following code to generate sales data of Books, Music, Electronic items, Videos, and Computers and tablets.
Step 3: Bind the TreeMap to data source
- To set appropriate properties for displaying the tree map chart, define a method named SetupChart() and add the following code.
- Call the SetupChart() method in the Form class constructor below the InitializeComponent() method.
Step 4: Build and run the project
- Click Build | Build Solution to build the project.
- Press F5 to run the project.