ComponentOne FlexChart for WinForms
SplineArea
FlexChart > Understanding FlexChart > FlexChart Types > SplineArea

The SplineArea chart is just like the area chart with the only difference in the manner in which data points are connected.  The SplineArea chart connects data points by using splines instead of straight lines, and fills the area enclosed by the splines.

You can set the ChartType property to SplineArea either at design-time or in code to create the SplineArea Chart.

To create the stacking SplineArea Chart, set the Stacking property to Stacked or Stacked100pc.

At the end of 2014, an international business magazine released a report ranking the topmost automobiles of the year on the basis of their resale values. The higher the resale value of an automobile, the better the ranking of the automobile. The same magazine released another report at the end of 2015 listing the best automobiles of 2015 on the basis of their resale values. There were a few vehicles that were common in both the reports.

Now, you need to compare the resale values of those vehicles in 2014 with that of 2015 with the help of the given data.

Let us do the same by using the SplineArea Chart.

Sample Data Table

Automobile Resale Value in 2014 (%) Resale Value in 2015 (%)
Toyota Tundra 55 52
GMC Canyon 47 49
Chevrolet Silverado 56 50
Ford F-150 69 68
Subaru Forester 67 65
Jeep Wrangler 88 91

SplineArea Chart


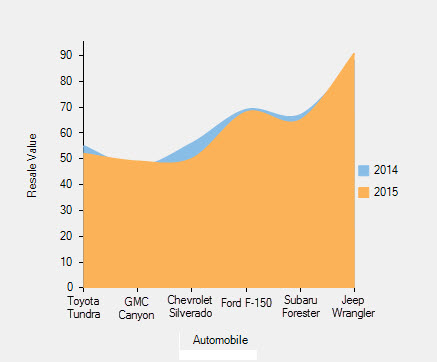
The above chart represents comparison in the resale values of specific automobiles in 2014 with that of 2015.

Here is the implementation in code:

' create a datatable
Dim dt As New DataTable("Resale Value 2014 vs 2015")

' add columns to the datatable
dt.Columns.Add("Automobile", GetType(String))
dt.Columns.Add("Resale Value in 2014", GetType(Integer))
dt.Columns.Add("Resale Value in 2015", GetType(Integer))

' add rows to the datatable
dt.Rows.Add("Toyota Tundra", 55, 52)
dt.Rows.Add("GMC Canyon", 47, 49)
dt.Rows.Add("Chevrolet Silverado", 56, 50)
dt.Rows.Add("Ford F-150", 69, 68)
dt.Rows.Add("Subaru Forester", 67, 65)
dt.Rows.Add("Jeep Wrangler", 88, 91)

' clear data series collection
FlexChart1.Series.Clear()

' create data series
Dim series1 As New C1.Win.Chart.Series()
Dim series2 As New C1.Win.Chart.Series()

' add the data series to the data series collection
FlexChart1.Series.Add(series1)
FlexChart1.Series.Add(series2)

' specify the datasource for the chart
FlexChart1.DataSource = dt

' bind the X-axis
FlexChart1.BindingX = "Automobile"

' bind the Y axes
series1.Binding = "Resale Value in 2014"
series2.Binding = "Resale Value in 2015"

' name the series
series1.Name = "2014"
series2.Name = "2015"

' set the chart type to splinearea
FlexChart1.ChartType = C1.Chart.ChartType.SplineArea
// create a datatable
DataTable dt = new DataTable("Resale Value 2014 vs 2015");

// add columns to the datatable
dt.Columns.Add("Automobile", typeof(string));
dt.Columns.Add("Resale Value in 2014", typeof(int));
dt.Columns.Add("Resale Value in 2015", typeof(int));

// add rows to the datatable
dt.Rows.Add("Toyota Tundra", 55, 52);
dt.Rows.Add("GMC Canyon", 47, 49);
dt.Rows.Add("Chevrolet Silverado", 56, 50);
dt.Rows.Add("Ford F-150", 69, 68);
dt.Rows.Add("Subaru Forester", 67, 65);
dt.Rows.Add("Jeep Wrangler", 88, 91);

// clear data series collection
flexChart1.Series.Clear();

// create data series
C1.Win.Chart.Series series1 = new C1.Win.Chart.Series();
C1.Win.Chart.Series series2 = new C1.Win.Chart.Series();

// add the data series to the data series collection
flexChart1.Series.Add(series1);
flexChart1.Series.Add(series2);

// specify the datasource for the chart
flexChart1.DataSource = dt;

// bind the X-axis
flexChart1.BindingX = "Automobile";
            
// bind the Y axes
series1.Binding = "Resale Value in 2014";
series2.Binding = "Resale Value in 2015";

// name the series
series1.Name = "2014";
series2.Name = "2015";
           
// set the chart type to splinearea
flexChart1.ChartType = C1.Chart.ChartType.SplineArea;