ComponentOne FlexChart for WinForms
Spline
FlexChart > Understanding FlexChart > FlexChart Types > Spline

The Spline Chart is similar to the line chart except that it connects data points by using splines rather than straight lines. The chart is used as an alternative to the line chart, but more specifically for representing data that requires the use of curve fittings.

You need to set the ChartType property to Spline either from the Properties window or in code behind to create the Spline Chart.

You can set the Stacking property to Stacked or Stacked100pc to create the stacking Spline Chart.

Consider that you are the sales analyst of a company ABC that releases its annual sales report every year. Being the sales analyst, you are asked to compare the sales of last two years, thereby creating a sales comparison report. The report needs to show the increasing/decreasing trends of the sales in the two years based upon the given sales data.

You can use the Spline Chart to create the required sales comparison report.

Sample Data Table

Month Sales in 2014 (1000 $) Sales in 2015 (1000 $)
Jan 8 23
Feb 11 24
Mar 12 22
Apr 15 22
May 17 24
Jun 18 27
Jul 19 26
Aug 20 27
Sep 22 24
Oct 22 26
Nov 23 27
Dec 20 25

Important Points

Spline Chart


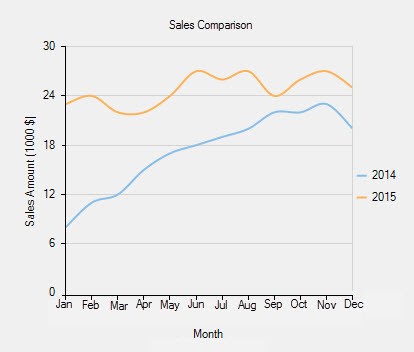
The above chart shows comparison between ABC sales for 2014 and 2015.

Here is the code demonstrating the implementation:

' create a datatable
Dim dt As New DataTable("Sales - 2014 vs 2015")

' add columns to the datatable
dt.Columns.Add("Month", GetType(String))
dt.Columns.Add("Sales in 2014", GetType(Integer))
dt.Columns.Add("Sales in 2015", GetType(Integer))

' add rows to the datatable
dt.Rows.Add("Jan", 8, 23)
dt.Rows.Add("Feb", 11, 24)
dt.Rows.Add("Mar", 12, 22)
dt.Rows.Add("Apr", 15, 22)
dt.Rows.Add("May", 17, 24)
dt.Rows.Add("Jun", 18, 27)
dt.Rows.Add("Jul", 19, 26)
dt.Rows.Add("Aug", 20, 27)
dt.Rows.Add("Sep", 22, 24)
dt.Rows.Add("Oct", 22, 26)
dt.Rows.Add("Nov", 23, 27)
dt.Rows.Add("Dec", 20, 25)

' clear data series collection
FlexChart1.Series.Clear()

' create data series
Dim series1 As New C1.Win.Chart.Series()
Dim series2 As New C1.Win.Chart.Series()

                  
' add the data series to the data series collection
FlexChart1.Series.Add(series1)
FlexChart1.Series.Add(series2)

' name the series
series1.Name = "2014"
series2.Name = "2015"

' specify the datasource for the chart
FlexChart1.DataSource = dt

' bind X-axis and Y-axis
FlexChart1.BindingX = "Month"
series1.Binding = "Sales in 2014"
series2.Binding = "Sales in 2015"

' set the chart type to spline
FlexChart1.ChartType = C1.Chart.ChartType.Spline
// create a datatable
DataTable dt = new DataTable("Sales - 2014 vs 2015");

// add columns to the datatable
dt.Columns.Add("Month", typeof(string));
dt.Columns.Add("Sales in 2014", typeof(int));
dt.Columns.Add("Sales in 2015", typeof(int));

// add rows to the datatable
dt.Rows.Add("Jan", 8, 23);
dt.Rows.Add("Feb", 11, 24);
dt.Rows.Add("Mar", 12, 22);
dt.Rows.Add("Apr", 15, 22);
dt.Rows.Add("May", 17, 24);
dt.Rows.Add("Jun", 18, 27);
dt.Rows.Add("Jul", 19, 26);
dt.Rows.Add("Aug", 20, 27);
dt.Rows.Add("Sep", 22, 24);
dt.Rows.Add("Oct", 22, 26);
dt.Rows.Add("Nov", 23, 27);
dt.Rows.Add("Dec", 20, 25);

// clear data series collection
flexChart1.Series.Clear();

// create data series
C1.Win.Chart.Series series1 = new C1.Win.Chart.Series();
C1.Win.Chart.Series series2 = new C1.Win.Chart.Series();
            
// add the data series to the data series collection
flexChart1.Series.Add(series1);
flexChart1.Series.Add(series2);

// name the series
series1.Name = "2014";
series2.Name = "2015";

// specify the datasource for the chart
flexChart1.DataSource = dt;

// bind X-axis and Y-axis
flexChart1.BindingX = "Month";
series1.Binding = "Sales in 2014";
series2.Binding = "Sales in 2015";

// set the chart type to spline
flexChart1.ChartType = C1.Chart.ChartType.Spline;