ComponentOne FlexChart for WinForms
Multiple Plot Areas
FlexChart > Working with FlexChart > FlexChart Elements > Multiple Plot Areas

Multiple plot areas allow you to increase the visibility of data by displaying each series in a separate plot area across one axis, keeping the other axis fixed.

FlexChart enables you to create multiple plot areas for different series within the same chart area. In FlexChart, create different plot areas and add them to the FlexChart.PlotAreas collection. In addition, you can customize the plot areas in terms of row index, column index, height, and width.

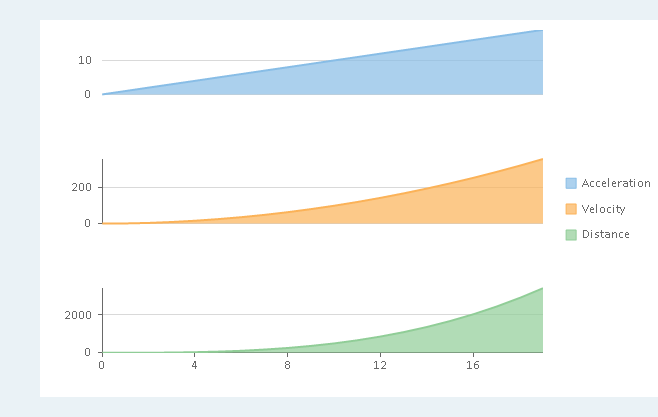
The following image displays multiple plot areas showing data for one series each in FlexChart.

The following code uses data regarding four metrics, namely, Acceleration, Velocity, Distance, and Time of a vehicle. The code demonstrates how to implement multiple plot areas in FlexChart.

' create and add multiple plot areas 
FlexChart1.PlotAreas.Add(New PlotArea() With {
    .Name = "plot1",
    .Row = 0
})
FlexChart1.PlotAreas.Add(New PlotArea() With {
    .Name = "plot2",
    .Row = 2
})
FlexChart1.PlotAreas.Add(New PlotArea() With {
    .Name = "plot3",
    .Row = 4
})

' specify the chart type
FlexChart1.ChartType = C1.Chart.ChartType.Area

' create, add, and bind series
FlexChart1.Series.Add(New Series() With {
    .Name = "Acceleration",
    .Binding = "Acceleration"
})


FlexChart1.Series.Add(New Series() With {
    .Name = "Velocity",
    .Binding = "Velocity",
    .AxisY = New Axis() With {
        .Position = C1.Chart.Position.Left,
        .MajorGrid = True,
        .PlotAreaName = "plot2"
    }
})

FlexChart1.Series.Add(New Series() With {
    .Name = "Distance",
    .Binding = "Distance",
    .AxisY = New Axis() With {
        .Position = C1.Chart.Position.Left,
        .MajorGrid = True,
        .PlotAreaName = "plot3"
    }
})
// create and add multiple plot areas 
flexChart1.PlotAreas.Add(new PlotArea { Name = "plot1", Row = 0 });
flexChart1.PlotAreas.Add(new PlotArea { Name = "plot2", Row = 2 });
flexChart1.PlotAreas.Add(new PlotArea { Name = "plot3", Row = 4 });

// specify the chart type
flexChart1.ChartType = C1.Chart.ChartType.Area;

// create, add, and bind series
flexChart1.Series.Add(new Series()
{
    Name = "Acceleration",
    Binding = "Acceleration",

});

flexChart1.Series.Add(new Series()
{
    Name = "Velocity",
    Binding = "Velocity",
    AxisY = new Axis()
    {
        Position = C1.Chart.Position.Left,
        MajorGrid = true,
        PlotAreaName = "plot2"
    },

});

flexChart1.Series.Add(new Series()
{
    Name = "Distance",
    Binding = "Distance",
    AxisY = new Axis()
    {
        Position = C1.Chart.Position.Left,
        MajorGrid = true,
        PlotAreaName = "plot3"
    }
});