A common issue pertaining to charts is the overlapping of data labels that represent data points. In most cases, overlapping occurs due to long text in data labels or large numbers of data points.
In case of overlapped data labels in FlexChart, it provides the following ways to manage the overlapping.
- Auto Arrangement of Data Labels
- Hide Overlapped Labels
- Control Appearance of Overlapped Labels
- Rotate Data Labels
- Trim or Wrap Data Labels
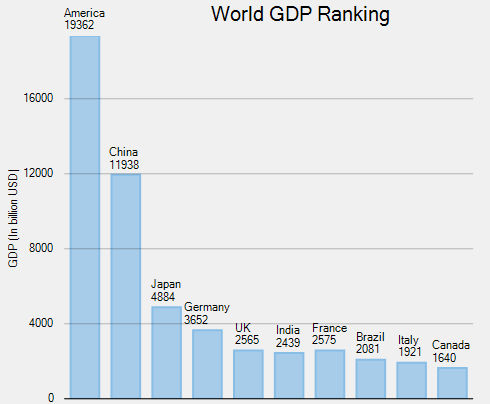
Auto Arrangement of Data Labels
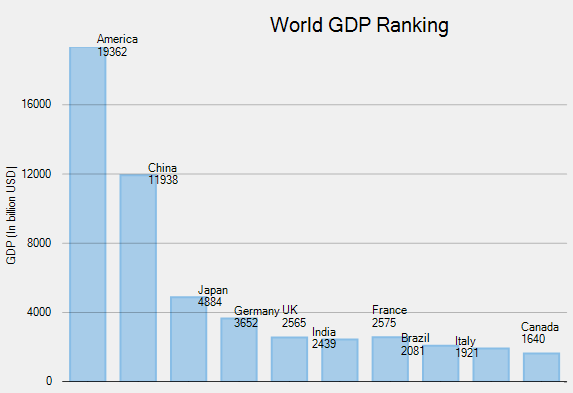
The easiest way to handle overlapping of data labels is to set the FlexChart to position the data labels automatically. For automatic positioning of data labels, you can set the Position property to Auto. Moreover, you can also set the MaxAutoLabels property to set the maximum number of labels that can be positioned automatically.
When the Position property is set to Auto, the number of created data labels is limited by MaxAutoLabels property which is 100 by default. You can increase the value of MaxAutoLabels property if necessary, but it may slow down the chart rendering since the label positioning algorithm becomes expensive in terms of performance when number of labels is large.
This approach may not provide an optimal layout when working with large data set and when there is no enough space for all data labels. In this case, it's recommended to reduce the number of data labels. For example, create a series with limited number of data points that should have labels, that is, chose to hide the labels at the individual series level.
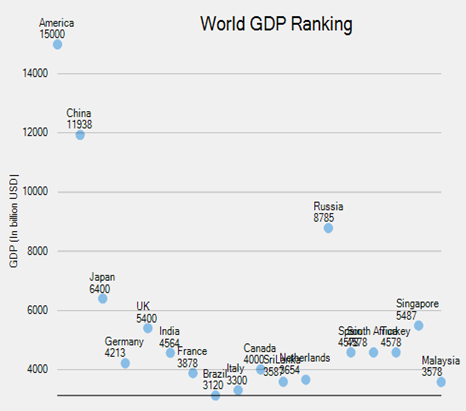
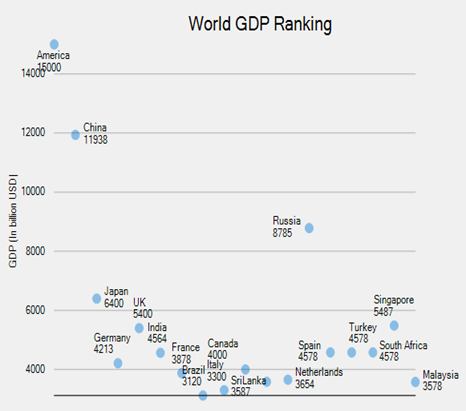
The image below shows how FlexChart appears after setting the Position and MaxAutoLabels property.
| LabelPosition.Top | LabelPostion.Auto |
|---|---|
 |
 |
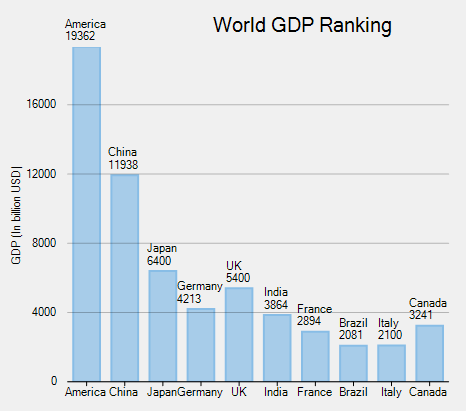
Hide Overlapped Labels
In case of overlapped data labels in FlexChart, you can use the Overlapping property provided by the DataLabel class. This approach is helpful when developer wants to completely hide or show the overlapped data labels.
The Overlapping property accepts the following values in the LabelOverlapping enumeration.
| Enumeration | Description |
|---|---|
| Hide | Hide overlapped data labels. |
| Show | Show overlapped data labels. |
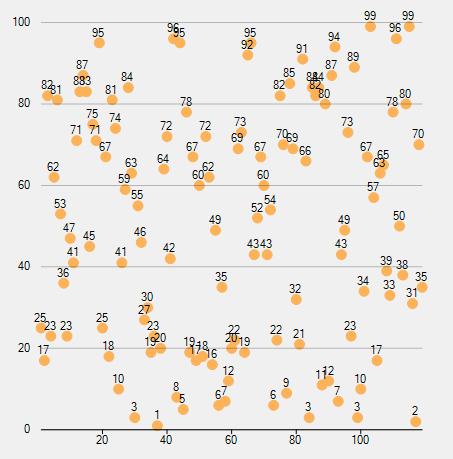
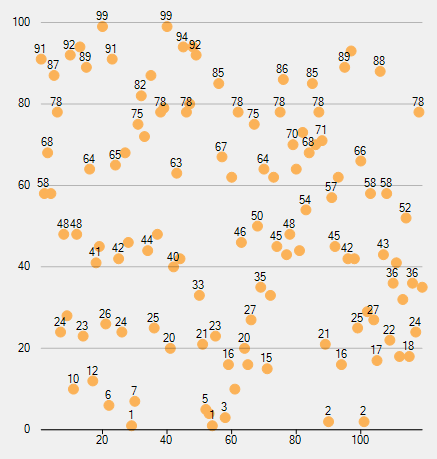
The image below shows how FlexChart appears after setting the Overlapping property.
| LabelOverlapping.Show | LabelOverlapping.Hide |
|---|---|
 |
 |
Control Appearance of Overlapped Labels
Furthermore, you can use the OverlappingOptions property to specify additional label overlapping options that will help the user to effectively manage overlapping of data labels.
The OverlappingOptions property accepts the following values in the LabelOverlappingOptions enumeration.
| Enumeration | Description |
|---|---|
| None | No overlapping is allowed. |
| OutsidePlotArea | Allow labels outside plot area. |
| OverlapDataPoints | Allow overlapping with data points. |
The image below shows how FlexChart appears after setting the LabelOverlappingOptions property.
| LabelOverlappingOptions.None | LabelOverlappingOptions.OutsidePlotArea |
|---|---|
 |
 |
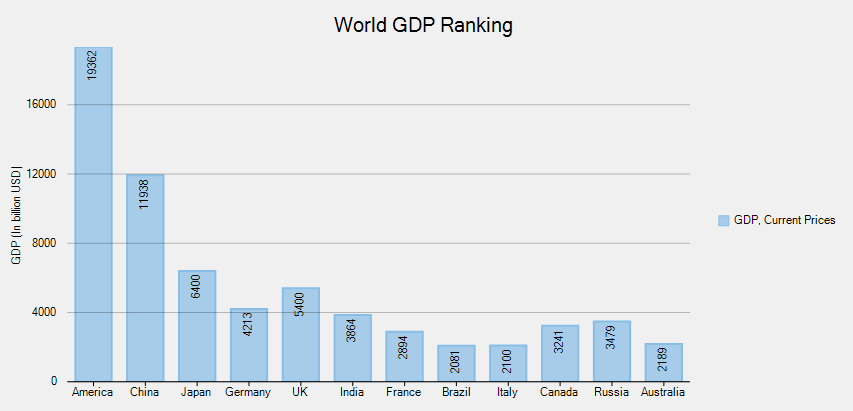
Rotate Data Labels
Another option to manage overlapping of data labels in FlexChart is to use the Angle property. The Angle property enables the user to set a specific rotation angle for data labels.
The image below shows how FlexChart appears after setting the Angle property.
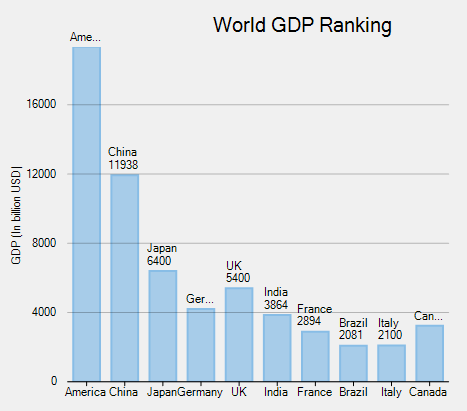
Trim or Wrap Data Labels
To manage the content displayed in the data labels, in case of overlapping, you can either trim the data labels or wrap the data labels using ContentOptions property. Managing of data labels using the ContenOptions property is dependent on MaxWidth and MaxLines property.
The MaxWidth property allows you to set the maximum width of a data label. In case the width of data label text exceeds the specified width, then you can either trim the data labels or wrap the data labels using the ContentOptions property.
The MaxLines property allows you to set the maximum number of lines in data label. This property helps you to limit the wrapped text to grow vertically. In case the wrapped text does not fit within the specified MaxWidth and MaxLines property values, then the last line gets trimmed with an ellipses(…).
The image below shows how FlexChart appears after setting the ContentOptions property.
| ContentOptions.None | ContentOptions.Trim |
|---|---|
 |
 |