ComponentOne FlexChart for WinForms
LineSymbols
FlexChart > Understanding FlexChart > FlexChart Types > LineSymbols

The LineSymbols Chart is a combination of the Line Chart and the Scatter Chart. The chart displays trends in data at equal intervals and visualizes relationship between two variables related to the same event. It plots data points by using symbols and connects the data points by using straight lines. 

You need to set the ChartType property to LineSymbols either at design-time or at run-time to create the LineSymbols Chart.

You can set the Stacking property to Stacked or Stacked100pc to create the stacking LineSymbols Chart.

Let's take a scenario in which two banks P and Q declare their fixed annual rates of interest on the amounts invested with them by investors for the period 2009-2015. The rates of interest offered by these banks differ from year to year based on the variations in the economy of the country.  

Now, we need to represent the annual rates of interest (in %) offered by these banks visually. And we are going to use the LineSymbols Chart to do the same. 

Sample Data Table

Bank 2009 2010 2011 2012 2013 2014 2015
P 7 9 8 10 8 7 6
Q 6 8 10 8 9 8 4

LineSymbols Chart

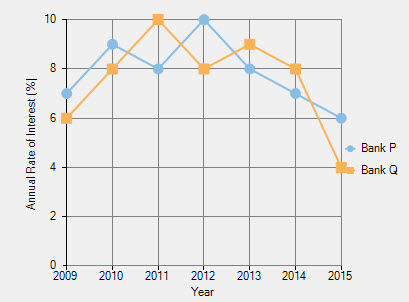
The above chart displays the annual rates of interest offered by two banks from 2009 to 2015.

Below is the implementation in code:

' clear data series collection
FlexChart1.Series.Clear()

' create data series
Dim series1 As New C1.Win.Chart.Series()
Dim series2 As New C1.Win.Chart.Series()

' add data points into the data series
series1.BindingX = "X"
series1.Binding = "Y"
series1.DataSource = New System.Drawing.Point() {
New System.Drawing.Point(2009, 7),
New System.Drawing.Point(2010, 9),
New System.Drawing.Point(2011, 8),
New System.Drawing.Point(2012, 10),
New System.Drawing.Point(2013, 8),
New System.Drawing.Point(2014, 7),
New System.Drawing.Point(2015, 6)}
series1.Name = "Bank P"

series2.BindingX = "X"
series2.Binding = "Y"
series2.DataSource = New System.Drawing.Point() {
New System.Drawing.Point(2009, 6),
New System.Drawing.Point(2010, 8),
New System.Drawing.Point(2011, 10),
New System.Drawing.Point(2012, 8),
New System.Drawing.Point(2013, 9),
New System.Drawing.Point(2014, 8),
New System.Drawing.Point(2015, 4)}
series2.Name = "Bank Q"

' add the data series to the data series collection
FlexChart1.Series.Add(series1)
FlexChart1.Series.Add(series2)

' set the chart type to linesymbols
FlexChart1.ChartType = C1.Chart.ChartType.LineSymbols
// clear data series collection
flexChart1.Series.Clear();

// create data series
C1.Win.Chart.Series series1 = new C1.Win.Chart.Series();
C1.Win.Chart.Series series2 = new C1.Win.Chart.Series();

// add data points into the data series
series1.BindingX = "X";
series1.Binding = "Y";
series1.DataSource = new System.Drawing.Point[] { 
new System.Drawing.Point(2009,7),
new System.Drawing.Point(2010,9),
new System.Drawing.Point(2011,8),
new System.Drawing.Point(2012,10),
new System.Drawing.Point(2013,8),
new System.Drawing.Point(2014,7),
new System.Drawing.Point(2015,6)};
series1.Name = "Bank P";

series2.BindingX = "X";
series2.Binding = "Y";
series2.DataSource = new System.Drawing.Point[] { 
new System.Drawing.Point(2009,6),
new System.Drawing.Point(2010,8),
new System.Drawing.Point(2011,10),
new System.Drawing.Point(2012,8),
new System.Drawing.Point(2013,9),
new System.Drawing.Point(2014,8),
new System.Drawing.Point(2015,4)};
series2.Name = "Bank Q";

// add the data series to the data series collection
flexChart1.Series.Add(series1);
flexChart1.Series.Add(series2);

// set the chart type to linesymbols
flexChart1.ChartType = C1.Chart.ChartType.LineSymbols;