ComponentOne FlexChart for WinForms
Line
FlexChart > Understanding FlexChart > FlexChart Types > Line

The Line Chart displays trends over a period of time by connecting different data points in a series with a straight line. It treats the input as categorical information that is evenly spaced along the X-axis.

You can create the Line Chart by setting the ChartType property to Line either at design-time or in code behind.

To create the stacking Line Chart, you need to set the Stacking property to Stacked or Stacked100pc.

Let there be a school XYZ with an initial strength of 3000 in 2011. The management of the school decides to find out the maximum, minimum, and average number of students in the school from 2011 to 2015. In addition, the management needs to know the time period in which the largest number of students left the school.

Let us visualize the given data by using the Line Chart.

Sample Data Table

Year Joined School Left School
2011 350 250
2012 300 450
2013 450 400
2014 500 350
2015 450 450

Important Points

Line Chart

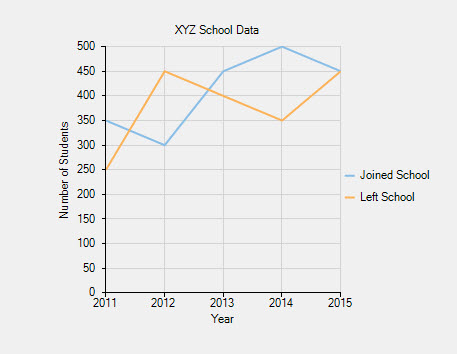
The above chart displays the number of students who joined and left the school from 2011 to 2015.

Below is the code that implements the aforementioned example:

' clear data series collection
FlexChart1.Series.Clear()

' create data series
Dim series1 As New C1.Win.Chart.Series()
Dim series2 As New C1.Win.Chart.Series()

' add data points into the data series
series1.BindingX = "X"
series1.Binding = "Y"
series1.DataSource = New System.Drawing.Point() {
New System.Drawing.Point(2011, 350),
New System.Drawing.Point(2012, 300),
New System.Drawing.Point(2013, 450),
New System.Drawing.Point(2014, 500),
New System.Drawing.Point(2015, 450)}
series1.Name = "Joined School"

series2.BindingX = "X"
series2.Binding = "Y"
series2.DataSource = New System.Drawing.Point() {
New System.Drawing.Point(2011, 250),
New System.Drawing.Point(2012, 450),
New System.Drawing.Point(2013, 400),
New System.Drawing.Point(2014, 350),
New System.Drawing.Point(2015, 450)}
series2.Name = "Left School"

' add the data series to the data series collection
FlexChart1.Series.Add(series1)
FlexChart1.Series.Add(series2)

' set the chart type to line
FlexChart1.ChartType = C1.Chart.ChartType.Line
// clear data series collection
flexChart1.Series.Clear();

// create data series
C1.Win.Chart.Series series1 = new C1.Win.Chart.Series();
C1.Win.Chart.Series series2 = new C1.Win.Chart.Series();

// add data points into the data series
series1.BindingX = "X";
series1.Binding = "Y";
series1.DataSource = new System.Drawing.Point[] { 
new System.Drawing.Point(2011,350),
new System.Drawing.Point(2012,300),
new System.Drawing.Point(2013,450),
new System.Drawing.Point(2014,500),
new System.Drawing.Point(2015,450)};
series1.Name = "Joined School";

series2.BindingX = "X";
series2.Binding = "Y";
series2.DataSource = new System.Drawing.Point[] { 
new System.Drawing.Point(2011,250),
new System.Drawing.Point(2012,450),
new System.Drawing.Point(2013,400),
new System.Drawing.Point(2014,350),
new System.Drawing.Point(2015,450)};
series2.Name = "Left School";

// add the data series to the data series collection
flexChart1.Series.Add(series1);
flexChart1.Series.Add(series2);

// set the chart type to line
flexChart1.ChartType = C1.Chart.ChartType.Line;