Legend group, as the name suggests, categorizes the legend entries of chart series based on the data represented by them. So, the multiple chart series with similar data can be better presented as groups in legend. This organizes the legends, which helps in better visualization and analysis of charts depicting multiple series.
FlexChart supports grouping respective legend items of different series in chart through LegendGroup property. By setting the LegendGroup property to a string value, you can specify the group name to which a particular series or legend item belongs. The series for which value of LegendGroup property is same are grouped together in the legend. However, if the LegendGroup property is not defined for a series then the series becomes a part of 0th group.
The value of LegendGroup property gets displayed as group title above the corresponding legend items. However, legend items that belong to the 0th group get displayed without any group title.
Positioning Legend Groups
The legend groups get positioned automatically with respect to each other depending on legend's position. For example, if the legends are positioned on top or bottom of the chart, then the legend groups are stacked horizontally one alongside the other. Whereas, if the legends are positioned to left or right of the chart, then the legend groups are stacked vertically one above the other.
Styling Legend Groups
FlexChart also supports styling and formatting of the legend group titles. The appearance of legend group titles can be customized by specifying the GroupHeaderStyle property.
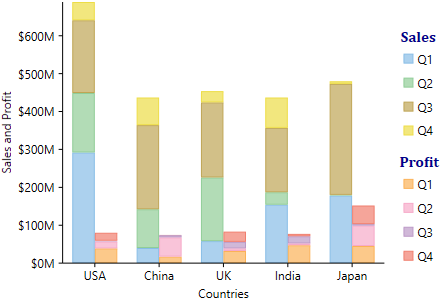
Following image shows a stacked chart that plots country-wise sales and profit of a company for different quarters of a year. Here, the legend items have been grouped together as per the stacked series for quick and easy analysis. The image also shows how legend and the legend groups have got positioned vertically and how appearance of the group titles can be customized.
Following code snippet demonstrates how to group the legends of respective series together by setting the Series.LegendGroup property of those series to the desired group name. The code snippet also shows how GroupHeaderStyle property can be used to style headers of the legend groups.
// specify legend group for each series
flexChart1.Series[0].LegendGroup = "Sales";
flexChart1.Series[1].LegendGroup = "Profit";
flexChart1.Series[2].LegendGroup = "Sales";
flexChart1.Series[3].LegendGroup = "Profit";
flexChart1.Series[4].LegendGroup = "Sales";
flexChart1.Series[5].LegendGroup = "Profit";
flexChart1.Series[6].LegendGroup = "Sales";
flexChart1.Series[7].LegendGroup = "Profit";

// stylise legend group header
flexChart1.Legend.GroupHeaderStyle.Stroke = Brushes.DarkBlue;
flexChart1.Legend.GroupHeaderStyle.Font = new Font(FontFamily.GenericMonospace, 10f, FontStyle.Bold);

flexChart1.EndUpdate();
To add series to the chart, use the following code snippet.
    InitializeComponent();
    SetupChart();
}
void SetupChart()
{
    flexChart1.BeginUpdate();
    flexChart1.BackColor = Color.White;
    flexChart1.Series.Clear();

    // Add data series
    var s1 = new Series();
    s1.Binding = "SalesQ1";
    s1.Name = "Q1";
    flexChart1.Series.Add(s1);

    var s2 = new Series();
    s2.Binding = "ProfitQ1";
    s2.Name = "Q1";
    flexChart1.Series.Add(s2);

    var s3 = new Series();
    s3.Binding = "SalesQ2";
    s3.Name = "Q2";
    flexChart1.Series.Add(s3);

    var s4 = new Series();
    s4.Binding = "ProfitQ2";
    s4.Name = "Q2";
    flexChart1.Series.Add(s4);

    var s5 = new Series();
    s5.Binding = "SalesQ3";
    s5.Name = "Q3";
    flexChart1.Series.Add(s5);

    var s6 = new Series();
    s6.Binding = "ProfitQ3";
    s6.Name = "Q3";
    flexChart1.Series.Add(s6);

    var s7 = new Series();
    s7.Binding = "SalesQ4";
    s7.Name = "Q4";
    flexChart1.Series.Add(s7);

    var s8 = new Series();
    s8.Binding = "ProfitQ4";
    s8.Name = "Q4";
    flexChart1.Series.Add(s8);

    // Set x-binding and add data to the chart
    flexChart1.BindingX = "Country";
    flexChart1.DataSource = DataCreator.CreateCountry();

    // set FlexChart stacking type
    flexChart1.Stacking = C1.Chart.Stacking.Stacked;

    // specify stacking group for each series
    flexChart1.Series[0].StackingGroup = 0;
    flexChart1.Series[1].StackingGroup = 1;
    flexChart1.Series[2].StackingGroup = 0;
    flexChart1.Series[3].StackingGroup = 1;
    flexChart1.Series[4].StackingGroup = 0;
    flexChart1.Series[5].StackingGroup = 1;
    flexChart1.Series[6].StackingGroup = 0;
    flexChart1.Series[7].StackingGroup = 1;
Data Source
This example uses the following data.
class DataCreator
{
    public static CountryDataItem[] CreateCountry()
    {
        var countries = new string[] { "USA", "China", "UK", "India", "Japan" };
        var count = countries.Length;
        var result = new CountryDataItem[count];
        var rnd = new Random();
        for (var i = 0; i < count; i++)
            result[i] = new CountryDataItem()
            {
                Country = countries[i],
                SalesQ1 = rnd.Next(320),
                ProfitQ1 = rnd.Next(50),
                SalesQ2 = rnd.Next(200),
                ProfitQ2 = rnd.Next(60),
                SalesQ3 = rnd.Next(300),
                ProfitQ3 = rnd.Next(20),
                SalesQ4 = rnd.Next(120),
                ProfitQ4 = rnd.Next(50),
            };
        return result;
    }
}
public class CountryDataItem
{
    public string Country { get; set; }
    public double SalesQ1 { get; set; }
    public double ProfitQ1 { get; set; }
    public double SalesQ2 { get; set; }
    public double ProfitQ2 { get; set; }
    public double SalesQ3 { get; set; }
    public double ProfitQ3 { get; set; }
    public double SalesQ4 { get; set; }
    public double ProfitQ4 { get; set; }
}