ComponentOne FlexChart for WinForms
DateTime Axis Grouping
FlexChart > Working with FlexChart > FlexChart Elements > Axis Labels > Axis Grouping > DateTime Axis Grouping

DateTime axis grouping is applicable in scenarios where the data displayed on the axis represents date time values. To implement date axis grouping in FlexChart, set the GroupProvider property to an object of the IAxisGroupProvider implementation.

In the example code below, we have created a class DateTimeGroupProvider that implements the IAxisGroupProvider interface. The interface provides GetLevels method that returns the group levels and GetRanges method that returns the group ranges for a given level. FlexChart also allows you to set the group separator using the GroupSeparator property.

As FlexChart grouping is possible at different hierarchical levels, the control also allows you to expand or collapse these groups. This can be implemented using the GroupVisibilityLevel property which takes an integer value.

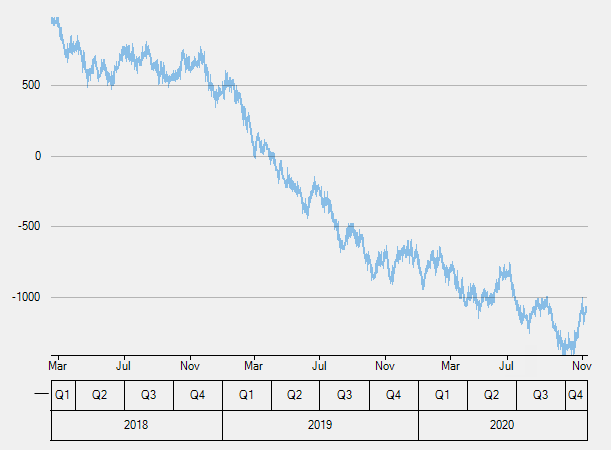
The following image shows how FlexChart appears after setting the date axis grouping.

DateAxisGrouping

Add the following code in Form1.cs file.

Public Partial Class Form1
    Inherits Form
    Private rnd As Random = New Random()
    Public Sub New()
        InitializeComponent()
        flexChart1.ChartType = ChartType.Line
        flexChart1.DataSource = CreateData()
        flexChart1.BindingX = "Time"
        flexChart1.Binding = "Price"
        flexChart1.AxisX.GroupProvider = New DateTimeGroupProvider()
        flexChart1.AxisX.Format = "MMM"

        flexChart1.AxisX.GroupVisibilityLevel = 1
        flexChart1.Series.Clear()
        flexChart1.AxisX.GroupSeparator = AxisGroupSeparator.Grid
        Dim series = New Series()
        flexChart1.Series.Add(series)
    End Sub

    Public Class DateTimeGroupProvider
        Inherits IAxisGroupProvider

        Public Function GetLevels(ByVal range As IRange) As Integer
            Return 2
        End Function

        Public Function GetRanges(ByVal range As IRange, ByVal level As Integer) As IList(Of IRange)
            Dim timeRange = TryCast(range, TimeRange)
            If timeRange Is Nothing Then Return Nothing
            Dim min = timeRange.TimeMin
            Dim max = timeRange.TimeMax
            Dim span = max - min
            Dim ranges As List(Of IRange) = New List(Of IRange)()
            Dim start As DateTime
            If level = 1 Then
                start = New DateTime(min.Year, (CInt(Math.Ceiling(CDbl(min.Month) / 3)) - 1) * 3 + 1, 1)
                ranges = Enumerable.Range(0, ((max.Month - start.Month) / 3 + 1) + 4 * (max.Year - start.Year)).[Select](Function(a) start.AddMonths(a * 3)).TakeWhile(Function(a) a <= max).[Select](Function(a) CType((New TimeRange("Q" & CInt(Math.Ceiling(CDbl(a.Month) / 3)), a, a.AddMonths(3))), IRange)).ToList()
            Else
                start = New DateTime(min.Year, 1, 1)
                ranges = Enumerable.Range(0, max.Year - start.Year + 1).[Select](Function(a) start.AddYears(a)).TakeWhile(Function(a) a <= max).[Select](Function(a) CType((New TimeRange(a.ToString("yyyy"), a, a.AddYears(1))), IRange)).ToList()
            End If

            Return ranges
        End Function
    End Class
End Class
public partial class Form1 : Form
    {
        Random rnd = new Random();
        public Form1()
        {
          InitializeComponent();
          //Set chart type and binding
          flexChart1.ChartType = ChartType.Line;
          flexChart1.DataSource = CreateData();
          flexChart1.BindingX = "Time";
          flexChart1.Binding = "Price";
          // Set axis grouping
          flexChart1.AxisX.GroupProvider = new DateTimeGroupProvider();
          flexChart1.AxisX.Format = "MMM";
          flexChart1.AxisX.GroupVisibilityLevel = 1;
          flexChart1.Series.Clear();
          flexChart1.AxisX.GroupSeparator = AxisGroupSeparator.Grid;
          // Add series
          var series = new Series();
          flexChart1.Series.Add(series);
        }
        public class DateTimeGroupProvider : IAxisGroupProvider
        {
            public int GetLevels(IRange range)
            {
                return 2;
            }

            public IList<IRange> GetRanges(IRange range, int level)
            {
                var timeRange = range as TimeRange;
                if (timeRange == null)
                    return null;
                var min = timeRange.TimeMin;
                var max = timeRange.TimeMax;
                var span = max - min;

                List<IRange> ranges = new List<IRange>();
                DateTime start;
                if (level == 1)
                {
                    start = new DateTime(min.Year, ((int)Math.Ceiling((double)min.Month / 3) - 1) * 3 + 1, 1);
                    ranges = Enumerable.Range(0, ((max.Month - start.Month) / 3 + 1) + 4 * (max.Year - start.Year)).Select(a => start.AddMonths(a * 3))
                   .TakeWhile(a => a <= max)
                   .Select(a => (IRange)(new TimeRange("Q" + (int)Math.Ceiling((double)a.Month / 3), a, a.AddMonths(3)))).ToList();
                }
                else
                {
                    start = new DateTime(min.Year, 1, 1);
                    ranges = Enumerable.Range(0, max.Year - start.Year + 1).Select(a => start.AddYears(a))
                   .TakeWhile(a => a <= max)
                   .Select(a => (IRange)(new TimeRange(a.ToString("yyyy"), a, a.AddYears(1)))).ToList();
                }
                return ranges;
            }
        }
    }