ComponentOne FlexChart for WinForms
Column
FlexChart > Understanding FlexChart > FlexChart Types > Column

The Column Chart, just like the Bar Chart, represents variation in a data series over time or compares different items. It displays values of one or more items as vertical bars against Y-axis and arranges items or categories on X-axis.

You need to set the ChartType property to Column either in the Property window or in code behind to create the Column Chart.

Set the Stacking property to Stacked or Stacked100pc to create the stacking Column Chart.

Let there be a company ABC that generates its performance report (of five years) for the period 2011-2015. The company calculates its annual profit by taking into account its income and expenditure in a year. Using the data, the company compares its annual profit in a particular year with that of the preceding year, thereby measuring its growth over the previous year.

Since the number of items to be compared are five, the Column Chart is apt for creating this report.

Sample Data Table

Year Income (1000 $) Expenditure (1000 $) Profit (1000 $)
2011 30 20 10
2012 50 30 20
2013 40 30 10
2014 60 40 20
2015 65 35 30

Column Chart


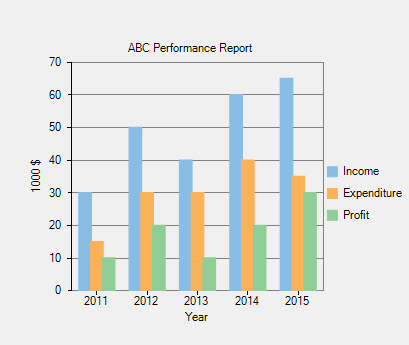
The above chart displays variation in the income, expenditure, and profit of the company ABC over the period 2011-2015.

The code below demonstrates the implementation:

' clear data series collection
flexChart1.Series.Clear()

' create data series
Dim series1 As New C1.Win.Chart.Series()
Dim series2 As New C1.Win.Chart.Series()
Dim series3 As New C1.Win.Chart.Series()

' add data points into the data series
series1.BindingX = "X"
series1.Binding = "Y"
series1.DataSource = New System.Drawing.Point() {
New System.Drawing.Point(2011, 30),
New System.Drawing.Point(2012, 50),
New System.Drawing.Point(2013, 40),
New System.Drawing.Point(2014, 60),
New System.Drawing.Point(2015, 65)}
series1.Name = "Income"

series2.BindingX = "X"
series2.Binding = "Y"
series2.DataSource = New System.Drawing.Point() {
New System.Drawing.Point(2011, 15),
New System.Drawing.Point(2012, 30),
New System.Drawing.Point(2013, 30),
New System.Drawing.Point(2014, 40),
New System.Drawing.Point(2015, 35)}
series2.Name = "Expenditure"

series3.BindingX = "X"
series3.Binding = "Y"
series3.DataSource = New System.Drawing.Point() {
New System.Drawing.Point(2011, 10),
New System.Drawing.Point(2012, 20),
New System.Drawing.Point(2013, 10),
New System.Drawing.Point(2014, 20),
New System.Drawing.Point(2015, 30)}
series3.Name = "Profit"

' add the data series to the data series collection
flexChart1.Series.Add(series1)
flexChart1.Series.Add(series2)
flexChart1.Series.Add(series3)

' set the chart type to column
flexChart1.ChartType = C1.Chart.ChartType.Column
// clear data series collection
flexChart1.Series.Clear();

// create data series
C1.Win.Chart.Series series1 = new C1.Win.Chart.Series();
C1.Win.Chart.Series series2 = new C1.Win.Chart.Series();
C1.Win.Chart.Series series3 = new C1.Win.Chart.Series();

// add data points into the data series
series1.BindingX = "X";
series1.Binding = "Y";
series1.DataSource = new System.Drawing.Point[] { 
new System.Drawing.Point(2011,30),
new System.Drawing.Point(2012,50),
new System.Drawing.Point(2013,40),
new System.Drawing.Point(2014,60),
new System.Drawing.Point(2015,65)};
series1.Name = "Income";

series2.BindingX = "X";
series2.Binding = "Y";
series2.DataSource = new System.Drawing.Point[] { 
new System.Drawing.Point(2011,15),
new System.Drawing.Point(2012,30),
new System.Drawing.Point(2013,30),
new System.Drawing.Point(2014,40),
new System.Drawing.Point(2015,35)};
series2.Name = "Expenditure";

series3.BindingX = "X";
series3.Binding = "Y";
series3.DataSource = new System.Drawing.Point[] { 
new System.Drawing.Point(2011,10),
new System.Drawing.Point(2012,20),
new System.Drawing.Point(2013,10),
new System.Drawing.Point(2014,20),
new System.Drawing.Point(2015,30)};
series3.Name = "Profit";

// add the data series to the data series collection
flexChart1.Series.Add(series1);
flexChart1.Series.Add(series2);
flexChart1.Series.Add(series3);

// set the chart type to column
flexChart1.ChartType = C1.Chart.ChartType.Column;