ComponentOne FlexChart for WinForms
Bubble
FlexChart > Understanding FlexChart > FlexChart Types > Bubble

The Bubble Chart, which is basically a type of the Scatter Chart, is used for graphical representation of multi-dimensional data. It displays an additional data value at each point by changing its size. The chart type represents data points in the form of bubbles (data markers) whose X and Y coordinates are determined by two data values and whose size indicates the value of a third variable.

To create the Bubble Chart, you need to set the ChartType property to Bubble either in the Properties window (at design-time) or code behind (at run-time).

Let's assume that there is a company XYZ, founded in 2003. The HR of the company needs to prepare an analysis report showing the development of the company from 2003 to 2015. For the analysis, the parameters to be considered are the average number of employees each year and the annual revenue in that particular year.

We can use the Bubble Chart to create the analysis report because we need to represent two data values (Y-values) for each X-value. In the chart, the vertical axis displays the number of employees each year and the size of the bubble represents the annual revenue for the same year.

Sample Data Table

Year Number of Employees Annual Revenue (1000 $)
2003 18 50
2004 20 55
2005 41 80
2006 64 100
2007 82 130
2008 105 160
2009 120 200
2010 65 105
2011 67 106
2012 63 100
2013 61 110
2014 79 115
2015 82 120

Bubble Chart


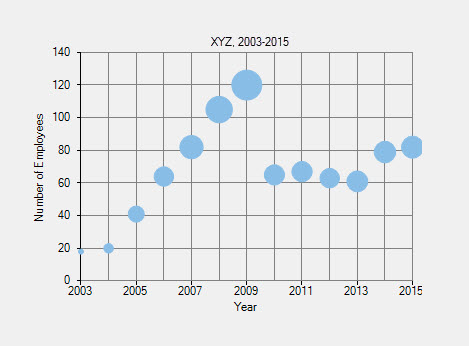
The above chart shows the development of the company XYZ in the period 2003-2015.

Below is the implementation in code:

' create a datatable
Dim dt As New DataTable("Company XYZ,2003-2015")

' add columns to the datatable
dt.Columns.Add("Year", GetType(Integer))
dt.Columns.Add("Number of Employees", GetType(Integer))
dt.Columns.Add("Annual Revenue", GetType(Integer))

' add rows to the datatable
dt.Rows.Add(2003, 18, 50)
dt.Rows.Add(2004, 20, 55)
dt.Rows.Add(2005, 41, 80)
dt.Rows.Add(2006, 64, 100)
dt.Rows.Add(2007, 82, 130)
dt.Rows.Add(2008, 105, 160)
dt.Rows.Add(2009, 120, 200)
dt.Rows.Add(2010, 65, 105)
dt.Rows.Add(2011, 67, 106)
dt.Rows.Add(2012, 63, 100)
dt.Rows.Add(2013, 61, 110)
dt.Rows.Add(2014, 79, 115)
dt.Rows.Add(2015, 82, 120)

' clear data series collection
FlexChart1.Series.Clear()

' create data series              
Dim series1 As New C1.Win.Chart.Series()

' add the data series to the data series collection
FlexChart1.Series.Add(series1)

' specify the datasource for the chart
FlexChart1.DataSource = dt

' bind X-axis and Y-axis
series1.BindingX = "Year"
series1.Binding = "Number of Employees,Annual Revenue"

' set the chart type to bubble
FlexChart1.ChartType = C1.Chart.ChartType.Bubble
// create a datatable
DataTable dt = new DataTable("Company XYZ,2003-2015");

// add columns to the datatable
dt.Columns.Add("Year", typeof(int));
dt.Columns.Add("Number of Employees", typeof(int));
dt.Columns.Add("Annual Revenue", typeof(int));

// add rows to the datatable
dt.Rows.Add(2003, 18, 50);
dt.Rows.Add(2004, 20, 55);
dt.Rows.Add(2005, 41, 80);
dt.Rows.Add(2006, 64, 100);
dt.Rows.Add(2007, 82, 130);
dt.Rows.Add(2008, 105, 160);
dt.Rows.Add(2009, 120, 200);
dt.Rows.Add(2010, 65, 105);
dt.Rows.Add(2011, 67, 106);
dt.Rows.Add(2012, 63, 100);
dt.Rows.Add(2013, 61, 110);
dt.Rows.Add(2014, 79, 115);
dt.Rows.Add(2015, 82, 120);

// clear data series collection
flexChart1.Series.Clear();

// create data series              
C1.Win.Chart.Series series1 = new C1.Win.Chart.Series();

// add the data series to the data series collection
flexChart1.Series.Add(series1);

// specify the datasource for the chart
flexChart1.DataSource = dt;

// bind X-axis and Y-axis
series1.BindingX = "Year";
series1.Binding = "Number of Employees,Annual Revenue";

// set the chart type to bubble
flexChart1.ChartType = C1.Chart.ChartType.Bubble;